Well Properties: Production Volumes Tab
The Production Volumes tab displays cumulative and monthly production and injection information as a table or a graph. The data views can be restricted using date ranges, and by limiting the fluid types being displayed. Production data can be imported using IHS 298 and columnar ASCII format files in the Well Import wizard, and can't be entered manually.
Production Entity: Select from a list of existing production entities for the selected well. Use the search bar to type in a search string, or click on the column headers to help you make your selection.
Display: Select the display method and the data to display.
- Cumulative Production: Display the cumulative production values in a table. The columns can be limited using the Fluids selector.
- Cumulative Injection: Display the cumulative injection values in a table. The columns can be limited using the Fluids selector.
- Monthly Production: Display the monthly production values in a table. The columns can be limited using the Fluids selector, and the rows can be limited using the Restrict Data To options.
- Monthly Injection: Display the monthly injection values in a table. The columns can be limited using the Fluids selector, and the rows can be limited using the Restrict Data To options.
- Cumulative Production Chart: Display the cumulative production values as a graph. The displayed data can be limited using the Fluids selector.
- Cumulative Injection Chart: Display the cumulative injection values as a graph. The displayed data can be limited using the Fluids selector.
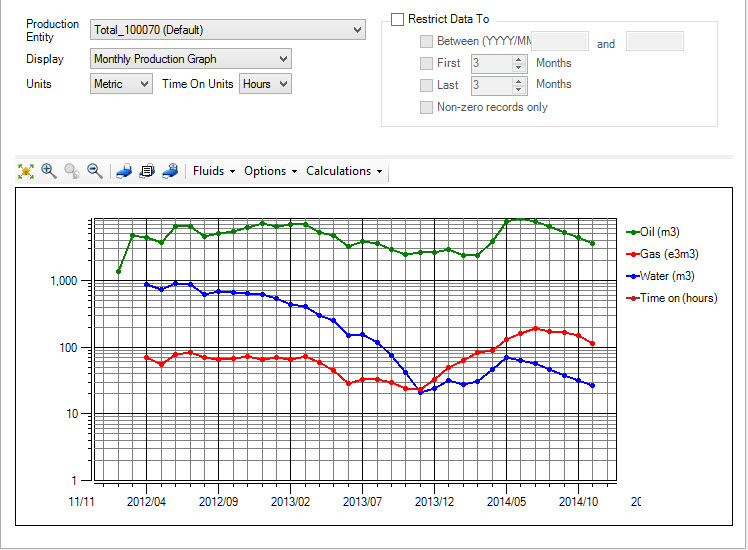
- Monthly Production Chart: Display the monthly production values as a graph. The displayed data can be limited using the Fluids selector, and the Restrict Data To options.
- Monthly Injection Chart: Display the monthly injection values as a graph. The displayed data can be limited using the Fluids selector, and the Restrict Data To options.
Units: Select the display units. Choose Metric or Imperial.
Time on Units: Select the time units. Choose Days or Hours.
Restrict Data
Restrict Data To: Restrict the data being displayed by entering a start and end date, or specifying a certain number of months at the beginning or end of the production period. Note: These settings are saved when you exit the window.
Between (YYYY/MM): Enter a start date and end date using the format YYYY (e.g. 2015) for cumulative data displays, and YYYY/MM (e.g. 2015/09) for monthly production displays.
First: Indicate the number of months you want displayed, starting with the first month of available production data.
Last: Indicate the number of months you want displayed, starting with the last month of available production data.
Non-zero records only: Turn this to exclude records with a value of zero from the display.
Note: If you restrict data using more than one method, you will output all of the data you specify. For example, if you have production data over a period of 2010/01 to 2015/11 and enter a date range of 2012/01 to 2012/12 as well as specifying the first three months of data, you will get data from 2010/01 to 2010/03 and data from 2012/01 to 2012/12 included in the export file.
Production Volume Table
Production volumes are displayed in table format when you select Cumulative or Monthly Production or Injection from the Display list. As long as you aren't applying any calculations, you can edit the values in the table, as well as delete entire rows of data. All of the columns can be sorted and reordered. The total production values are displayed at the bottom of the table, and will remain visible even when you scroll.
The following options are available when displaying production graphs.
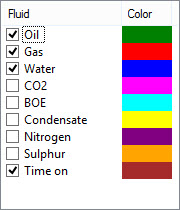 Fluids: Select the fluids you want included in the table or graph by placing a check mark next to the fluid name. To change the display color, click on the color in the Color column, and select a new color from the Color dialog box. Note: These settings are saved when you exit the window.
Calculations: Apply additional calculations to the data being displayed.
Allocate Wells: When a production entity is associated with multiple wells, turning this on will allow you to see the average production values for a single well. The units on the table and graph displays will reflect this calculation.
Show daily rates using factor: This is available when you are displaying monthly data. Enter the value you want to use to convert monthly rates into daily rates. The units on the table and graph displays will reflect this calculation.
Production Volume Graph
Production volumes are displayed in graph format when you select Cumulative or Monthly Production Graph or Injection Graph from the Display list.
![]() Fit to Window: Scale the graph so that all production data is visible.
Fit to Window: Scale the graph so that all production data is visible.
![]() Zoom In: Enter zoom mode, and then click and drag out a rectangle to change the extents of the graph display. This will change the scale on both the X and Y axes. You will stay in zoom mode until you click the icon again. Once the display is zoomed, and after exiting zoom mode, you can use your cursor to pan the display.
Zoom In: Enter zoom mode, and then click and drag out a rectangle to change the extents of the graph display. This will change the scale on both the X and Y axes. You will stay in zoom mode until you click the icon again. Once the display is zoomed, and after exiting zoom mode, you can use your cursor to pan the display.
![]() Undo Zoom: Sequentially undo all of the zoom operations.
Undo Zoom: Sequentially undo all of the zoom operations.
![]() Zoom Out: Zoom out on the display, doubling the visible range on both axes.
Zoom Out: Zoom out on the display, doubling the visible range on both axes.
![]() Print: Print the graph currently being displayed. You can change the Print Setup options, including page size and orientation, from the Print Preview window.
Print: Print the graph currently being displayed. You can change the Print Setup options, including page size and orientation, from the Print Preview window.
![]() Print
Preview: Open a Print Preview window to see how the graph currently being displayed will appear on the page when it is printed.
Print
Preview: Open a Print Preview window to see how the graph currently being displayed will appear on the page when it is printed.
![]() Print Properties: Open the Print Properties dialog box to add a title to the graph, and turn on axis labels and legend information.
Print Properties: Open the Print Properties dialog box to add a title to the graph, and turn on axis labels and legend information.
Fluids: Select the fluids you want included in the table or graph by placing a check mark next to the fluid name. To change the display color, click on the color in the Color column, and select a new color from the Color dialog box.
Options: Specify the display options for the graph.
Major Grid Lines: Turn the major grid lines on or off. To change the color of the major grid lines, click on the color indicator, and select a new color from the Color dialog box.
Minor Grid Lines: Turn the major grid lines on or off. To change the color of the minor grid lines, click on the color indicator, and select a new color from the Color dialog box.
Logarithmic Scale: Turn logarithmic scaling for the production volume axis on or off.
Data Points: Apply symbols to the data points, and specify their size.
Calculations: Apply additional calculations to the data being displayed. Note: These settings are saved when you exit the window.
Allocate Wells: When a production entity is associated with multiple wells, turning this on will allow you to see the average production values for a single well. The units on the table and graph displays will reflect this calculation.
Show daily rates using factor: This is available when you are displaying monthly data. Enter the value you want to use to convert monthly rates into daily rates. The units on the table and graph displays will reflect this calculation.
Show running totals: When displaying cumulative production values, display the total volume instead of the volume for the corresponding period of time.
Well Properties Tabs
- Well Tab
- Tops Tab
- Formations Tab
- Sources Tab
- Velocity Curves Tab
- Log Curves Tab
- Synthetics Tab
- Directional Surveys Tab
- Raster Logs Tab
- Production Entity Tab
- Production Volumes Tab
- Advanced Tops Tab
- Advanced Velocities Tab
- Advanced Logs Tab
- Advanced Synthetics Tab
- Advanced Production Tab
— MORE INFORMATION

|
Copyright © 2020 | SeisWare International Inc. | All rights reserved |