Link Culture: Display Settings
Use the Display Settings page to set up how individual objects within the linked layer will be displayed.
Note:
This page is not available when linking
to a SeisWare layer.

Use
Specify if objects will be displayed based on individual
characteristics.
Single
Value:
Use this to display all of the objects within the layer in the same
way. When this is selected only some properties will be grayed out.
Range of
Values: Use this to display
all of the objects that fall within
a range of
values in the same way.
Unique Values:
Use this to display all of the objects within
the layer that have a
particular value
in the same way.
Default Line
Specify the default line properties.
Color:Select a color for all of the
lines
in
the layer.
Pattern: Select
the line pattern of all of the lines in the layer.
Width:Select
the line width for all of the lines in the layer. A size of 0 is
the thinnest line available. You can use the arrow keys to increase or
decrease the line width.
Default Fill
Specify the default fill properties.
Color:Select a color for the
interior
fill of all closed polygons in
the layer.
Pattern: Select
the fill pattern of all closed polygons in the layer.
Default Symbol:
Specify the default symbol properties.
Color:Select a color for all of the
symbols in the layer.
Shape:Select
the symbol shape of all of the points in the layer.
Size:Select
the size for all of the symbols in the layer.
Values outside of the ranges
When objects are present in the file but aren't represented in the
table, specify whether they should be displayed using default
parameters or not at all.
Display using defaults:Use this to
display any objects whose values' don't appear in the table with
default display parameters.
Do not display:Do not display any objects
whose values' don't appear in the
table.
Values Table
When using the Unique Values
or
Range of Values option, you
will need to select the field that will be used to assign properties to
the layer objects. This can be done automatically, and then you can
manually edit the values and properties in the table.
Field Name:When using the Unique Values or Range of Values option, select the field from the layer to use to define the display settings.
Generate Values:Click this after selecting the field name that you want used to assign properties to the layer objects.
Using Unique
Values: The
table will be populated with
all of the values that are found in the layer for this field.
It
will use the default symbol, line for fill
options (depending on the layer type) and then change the color for
each individual value.
You can manually change the values in the table after it has
been
populated, and can add or remove rows.
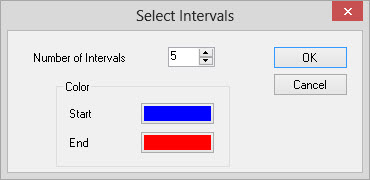
Using
a Range of Values: You
can specify the number of intervals to break the data into, and the
start and stop color.
It will look the layer for all of the values and then break
it into the number of intervals that you have specified. You can
manually change the values in table after the intervals have
automatically been created, and can add or remove rows.
![]() Add:
Add a row after the last column of the table.
Add:
Add a row after the last column of the table.
![]() Delete:
Select a row and remove it from the
table. Any data that is removed will follow the assigned behavior of
the Data outside of the ranges
setting.
Delete:
Select a row and remove it from the
table. Any data that is removed will follow the assigned behavior of
the Data outside of the ranges
setting.
— MORE INFORMATION

|
Copyright © 2020 | SeisWare International Inc. | All rights reserved |