Defining Keywords
The SEG-Y Viewer is used to examine SEG-Y files and to
specify
the location of certain critical
keywords during data loading.

Defining keywords is one of the most important steps performed during
data
loading. You need to define keywords so that SeisWare can
extract
crucial information from the headers of the SEG-Y
file.
How do I define a keyword?
To load data, you need to
specify where certain
information is kept in the headers of the SEG‑Y file. We call the
information
that you need "Keywords".
- Define the keywords required
for the line you are loading.
For 2D lines, you must define keywords for:
- EBCDIC Header: The EBCDIC header has important information about a line, such as a company name, a line name, processing type and formats, and the Keyword byte offsets.
- Binary Header: Some important settings are here, such as the sample rate of the data.
- Trace Data: The actual seismic data is stored here.
- Trace Header: The Keywords are stored here.
Keywords are stored in the Trace Header Data View, but can be in any of the listed Formats. Try switching among the file formats to see how the values change. You will usually see the Keywords in integer (32 bit), or one of the IBM or IEEE floating-point formats.
You
can see how the Keyword values
change when you scroll
( )
through the traces, use the arrows (
)
through the traces, use the arrows ( ),
or enter a trace number.
),
or enter a trace number.
Note: The Data View type must be Trace Data or Trace Header before the Trace Number field is active.
- Once all of the keywords
have been defined, you will see
displayed in the white box on the right side of the SEG-Y
Viewer.
Check that they are defined correctly, with
appropriate
values and decimal places.
- From
the File
menu,
select Save
Keywords As.
- Enter
a Keyword file name that you will remember and click
 .
SeisWare automatically adds the .kwd
extension to the file name.
.
SeisWare automatically adds the .kwd
extension to the file name. - Close
the SEG-Y Viewer.
Defining the CDP
The CDP number normally increases
by 1 as the trace
number increases by 1. As a result, the graph of the CDP
Number
increases
with a
constant slope. Scroll
through the traces to find the CDP, then graph the value to ensure that
the
number increases for the entire file.
- Click
on the CDP and ensure that the cursor is blinking within the number.
- Click
the graph icon
 at
the
top of the SEG-Y Viewer. SeisWare opens the
Graph Header Word window.
at
the
top of the SEG-Y Viewer. SeisWare opens the
Graph Header Word window.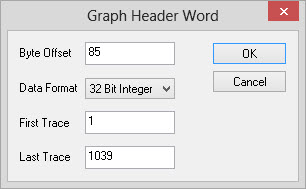
- Click
 to
graph all traces in the file. Check that the graph
has a
constant
slope. Close
the SeisWare Graph.
to
graph all traces in the file. Check that the graph
has a
constant
slope. Close
the SeisWare Graph. - To
define the Keyword, click on the key icon
 .
SeisWare opens the Add Keyword window.
.
SeisWare opens the Add Keyword window.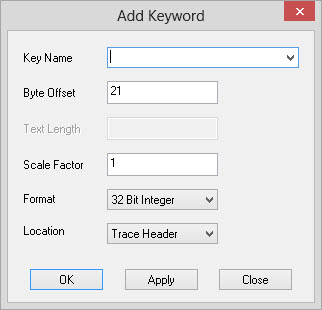
- From
the drop-down list beside Key
Name, select
"CDP
Number"
and click .
Defining
the
Shot Sequence Number
To search for the Shot Sequence Number, switch to the Trace Header view, scroll through the traces one by one, and look for a number that increments by 0.5. Because some formats do not have decimals, the shot sequence might increase by an integer value, for example, 50 or 500. If you scroll through a few traces and don’t see a number that increments by such an amount, change the file Format and try again. When you identify the shot sequence number, you need to graph it to ensure that the values increment constantly for the entire file.
- Click
on the Shot Sequence Number and ensure that the cursor is blinking
within the
number.
- Click
the graph icon at
the
top of the SEG-Y Viewer. SeisWare opens the Graph Header Word window.
- Click
to
graph all traces in the file. Check that the graph
has a
constant
slope.
- Close
the SeisWare Graph.
- To
define the Keyword, click on the key icon .
SeisWare opens the Add
Keyword window.
- From
the drop-down list beside Key
Name, select
"Shot
Sequence
Number" and
click .
- If
the Shot Sequence Number is increasing by an integer such as 5, you
need to
select a scale factor of 0.1 to correct this. In this case, because the
shot
sequence number does increase by 5, enter a scale factor of 0.1.
Defining the Line
Sequence Number
The
Line Sequence Number only changes after you scroll through all traces
for the line. You might have to scroll through many traces
before
the Line Sequence Number increments by 1. Scroll
through the traces to find the Line Sequence Number, then graph
the
value to ensure that
the
number increases for the entire file.
- Click
on the Line Sequence Number and ensure that the cursor is blinking
within the number.
- Click
the graph icon at
the
top of the SEG-Y Viewer. SeisWare opens the
Graph Header Word window.
- Enter in "2000" in the Last
Trace field to
limit the number of traces to graph and click .
Check that the Line
Sequence Number graph resembles
a step
function with a constant slope. Each step represents a
different
line.
- Close
the SeisWare Graph.
- To
define the Keyword, click on the key icon .
SeisWare opens the Add Keyword window.
- From
the drop-down list beside Key
Name, select
"Line
Sequence
Number"
and click .
Defining the
Trace Sequence Number
The
Trace Sequence Number increase by 1 until the Line Sequence Number
increments, then the Trace Sequence Number drops to its starting point
and begins increasing again. Scroll
through the traces to find the Trace Sequence Number, then graph
the
value to ensure that
the
number increases for the entire file.
- Click
on the Trace Sequence Number and ensure that the cursor is blinking
within the number.
- Click
the graph icon at
the
top of the SEG-Y Viewer. SeisWare opens the
Graph Header Word window.
- Enter in "2000" in the Last
Trace field to
limit the number of traces to graph and click .
Check that the Trace
Sequence Number graph resembles
a saw
tooth.
Every increasing spike represents an increasing trace number
within the 3D survey.
- Close
the SeisWare Graph.
- To
define the Keyword, click on the key icon .
SeisWare opens the Add Keyword window.
- From
the drop-down list beside Key
Name, select
"Trace
Sequence
Number"
and click .
Defining
the Coordinate X and Coordinate Y
If the data is from Canada the Coordinate X value will have six digits and the Coordinate Y value will have seven digits. These keywords can be found side by side in the SEG-Y viewer. If you have seven and eight digit numbers, you will need to apply a scale factor of 0.1. The graphs for these Keywords have an increasing or decreasing slope. They are usually linear, although they can have bends if the lines are crooked.
- Click
on the Coordinate X ensure that the cursor is blinking
within the
number.
- Click
the graph icon at
the
top of the SEG-Y Viewer. SeisWare opens the Graph Header Word window.
- Click
to
graph all traces in the file. Check the graph.
- Close
the SeisWare Graph.
- To
define the Keyword, click on the key icon .
SeisWare opens the Add
Keyword window.
- From
the drop-down list beside Key
Name, select
"Coordinate
X"
or "Coordinate Y" and
click .
Also See
— MORE INFORMATION

|
Copyright © 2020 | SeisWare International Inc. | All rights reserved |