Grid Despike
The Grid Despike tool allows you to remove spikes from existing grids using user defined constraints.
-
Select the grid(s) to be despiked.
-
Set the Grid Value Constraint options for detecting spikes.
-
Set the Filling Options to specify how spikes will be treated.
-
(Optionally) Click
 to set the constraining
polygons. Note:
Inclusion polygons
affect grid values contained within the polygon, and
exclusions polygons affect grid values that lie outside of the polygon.
to set the constraining
polygons. Note:
Inclusion polygons
affect grid values contained within the polygon, and
exclusions polygons affect grid values that lie outside of the polygon. -
Click
 to start the despiking
operation.
to start the despiking
operation. -
Set the Output Name in the Grid Outputs dialog.
General Information
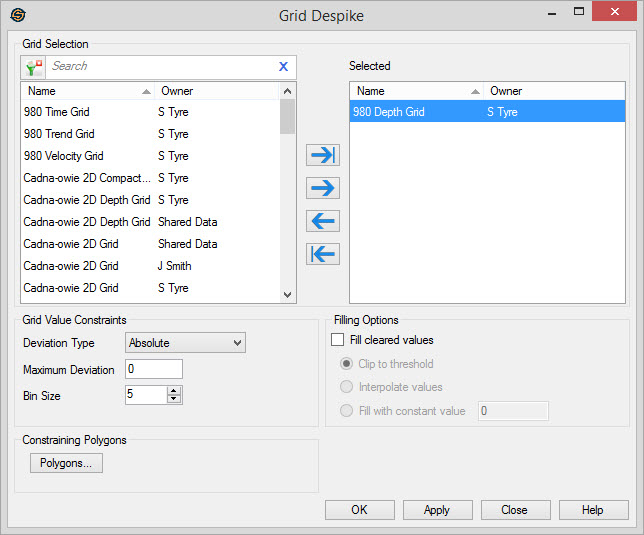
Grid Selection
Select the grids you want to despike. Left click to select a grid, or use the Ctrl key on your keyboard to select multiple grids, and then use the selection arrows to move the grids to the Selected list. Alternately, you can move a single grid to the Selected list by double clicking on it.
To help you make your grid selections, you can sort any column by left
clicking
on the column header, you can apply a filter
(![]() ), or
you can type a search string
into the search
bar to limit the list using Name,
or
Owner
information.
), or
you can type a search string
into the search
bar to limit the list using Name,
or
Owner
information.
For additional selection and navigation options right click on the list
of grids to access
the shortcut
menu.
Grid Value Constraints
Select the criteria for identifying spikes in the grid data. Values that deviate beyond a threshold from the local mean are identified as "spikes".
Deviation
Type: Select the method
for identifying spikes.
Absolute:
Identifies and
clears points
that are an absolute value away from the mean (calculated from the
grid). The absolute value is determined by the Maximum Deviation
value that you
enter.
Percent: Identifies
and clears
points that are a given percentage value away from the
mean (calculated from the grid). The percentage absolute value is
determined by
the Maximum
Deviation
value that you enter.
Standard Deviation: Identifies and clears points that are not within the specified number of standard deviations from the mean (calculated from the grid). The number of standard deviations is determined by the Maximum Deviation value that you enter.
Maximum Deviation:The magnitude by which a value can deviate from the mean, in units specified under Deviation Type.
Grid
Size
(inline/crossline): Dimensions
of the bin
defining the local area of a data
point.
The criteria for identifying "spikes" in the grid data. Values that
deviate beyond a threshold from the local mean are
identified as "spikes".
Filling Options
Options for filling cleared spikes. By default, spikes are cleared and
grids are left blank.
Fill Cleared values: Turn on this option to fill clear values instead of leaving grids blank, and then select the fill method.
Clip
to threshold:Sets the value of a
spike data point to that of the threshold it exceeded.
Interpolate
values: Sets
the value of a spike data point to that of the local mean.
Fill
with constant value:
Sets the value of a spike
data point to a given value.
Constraining Polygons
Polygons: Click to
open the Select
Polygon dialog to use
a polygon to limit the geographical extents of your despiking operation.
Apply
Before the operation can be completed you need you specify the name of the output grid.
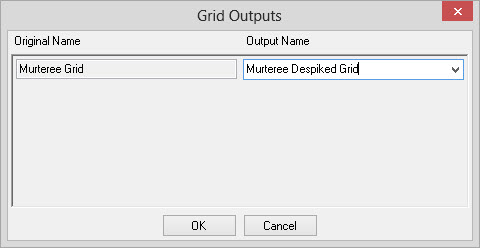
Original Name: Name of the original grid.
Output
Name: Name of the
output grid.
This can be left at the default "Original
Name Despiked", entered manually, or selected from an existing grid in
the drop down menu.
— MORE INFORMATION

|
Copyright © 2020 | SeisWare International Inc. | All rights reserved |