3D View Tools: Surface Display and Data
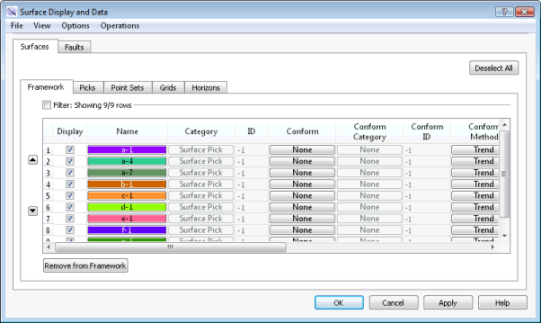
Use the Surface Display and Data dialog box to select the surfaces to display in the window, create your project framework, and turn on conformable gridding. You can also access the dialog boxes used to set the default grid and contour parameters. Many of the settings in this window will affect the surface displays throughout the project.
To open the Surface Display and Data dialog box, on the Buttons toolbar click  , or from theEdit menu select Surfaces.
Menus
There are menus at the top of the dialog box to access additional tools and options.
File Menu: Use the File menu to save your project, access import and export options, and save and load StratColumn files. ![]() See File menu options...
See File menu options...
View Menu: Use the View menu to expand the data tables on the Surfaces and Faults tabs to display the extrapolation and gridding parameters associated with each layer.
Options Menu: Use the Options menu to set grid and contour display preferences, adjust the grid parameters for multiple surfaces, and set automatic picking preferences. ![]() See Options menu options...
See Options menu options...
 , and then clicking on a cell displaying a grid parameter.
Operations Menu: Use the Operations menu to delete, copy, and merge surfaces, and to access the Grid Operations and Data Operations dialog boxes. ![]() See Operations menu options...
See Operations menu options...
Surfaces and Faults Tabs
Use the Surfaces and Faults tabs to select the surfaces and faults you want to display in your cross section, and adjust their display properties. You can turn on data from any tab. Each tab contains the associated display options for each data type, as well as informational fields that can't be edited. Move data items of any type to the Framework tab to create a subset of your project data, order the data in geologic time, and turn on conformable gridding for a more geologically accurate interpretation.
 Deselect All: Remove the check mark from the Display column for all surfaces on all tabs.
 /
/ More/Less: Click to display the gridding parameters for the surface. Click to display only the display properties.
 Move to Framework: Move the selected surfaces to the Framework tab.
 Remove from Framework: Remove the selected surfaces from the Framework tab. This does not remove the data from the project. It will still be available on the data tab.
Framework Tab
 Move Selected Rows Up: Move the selected surface higher in the Framework list. The order that surfaces appear in this list corresponds to the depth at which they occur. Note that on all of the other tabs, the data is listed alphabetically.
 Move Selected Rows Down: Move the selected surface lower in the Framework list. The order that surfaces appear in this list corresponds to the depth at which they occur. Note that on all of the other tabs, the data is listed alphabetically.
Column Definitions
The following is a list of definitions for the columns found of the Framework tab. Note that the other tabs will only have the columns relevant to the specific data type.
Display: Place a check mark next to each surface you want to display.
Name: The name and color of the surface. Click on the name to open the Change Surface Color dialog box to change the color of the surface for the entire project. On every other tab, click on the name to open the Copy Surface or Change Surface Color dialog box to create a copy of the surface with a different name, or change the surface color of the surface for the entire project.
Category: The surface type. This informational column is useful on the Framework tab where multiple data types can be present.
ID: Any value other than “-1” indicates that the data was loaded from OpenWorks. This column is for information only.
Conform: Click in the cell to open the Choose One Surface dialog box to select the surface that will be used in conjunction with the Conform Method to create the final displayed surface. Conformable gridding is typically used when you have a surface with limited data, and it allows you to use a surface above or below that has better data control, to shape the final surface. When this is set to None, the Conform Category, Conform Method, Conform Distance, Conform Transition, and Conform Thicknesscolumn aren't used. Clicking on the Conform heading will allow you to automatically turn on conformable gridding for all surfaces in the project framework. ![]() See automatic conform options...
See automatic conform options...
Conform Category: The surface type of the conform surface. This column is for information only.
ID: Any value other than “-1” indicates that the data was loaded from OpenWorks. This column is for information only.
Conform ID: Any value other than “-1” indicates that the conform surface was loaded from OpenWorks. This column is for information only.
Conform Method: Open the Set Grid Conformability Parameters dialog box to select the conform options. Clicking on the column header will assign the same Method to all surfaces using the default parameters.
Color Overlay: Select an overlay option to specify how to apply color to the surface in conjunction with the Style selection. ![]() See Color Overlay options
See Color Overlay options
Style: Specify how the surface should appear in the display. Choose from Mesh , Filled, Filled with Mesh, Filled with Contours, Transparent, Transparent with Mesh, or Contours.
Culture: Open the Culture Overlay dialog box to select which annotations, culture layers, faults sets, and intersections should be projected onto the surface.
Algorithm: Select a gridding algorithm. Choose from Minimum Curvature, Radial Search, Radial (Clustered), or Weighted.
Dynamic Terminations: Select a dynamic termination method for the surface to determine how interactions with shallower and deeper surfaces will be treated. ![]() See Dynamic Termination options...
See Dynamic Termination options...
Surface Filter: Open the Surface Filter dialog box to determine which picks are used to create a surface based on their confidence rating, or a defined well group. ![]() See Surface Filter options...
See Surface Filter options...


Extrapolation Controls
When you click to display the gridding parameter columns, you will have access to the extrapolation controls, which determine how to extend the edges of the surface past the interpreted data points. Click in the Extrapolation Method, Extrapolation Buffer, or Hull Connectivity cells to open the Extrapolation Controls dialog box.
Gridding Parameters
When you click to display the gridding parameter columns, you will see the gridding parameters being used to calculate each surface. Click on the Search Radius, Avg Distance, Smoothing Iterations, Fill Distance, Octants Needed, Conform Distance, Conform Transition or Conform Thickness cells to open the Set Gridding Parameters dialog box. To adjust the gridding parameters for all surfaces, from the Options menu, select Gridding Parameters.
— MORE INFORMATION

|
Copyright © 2020 | SeisWare International Inc. | All rights reserved |