Map View Tools: Create a Zone Average
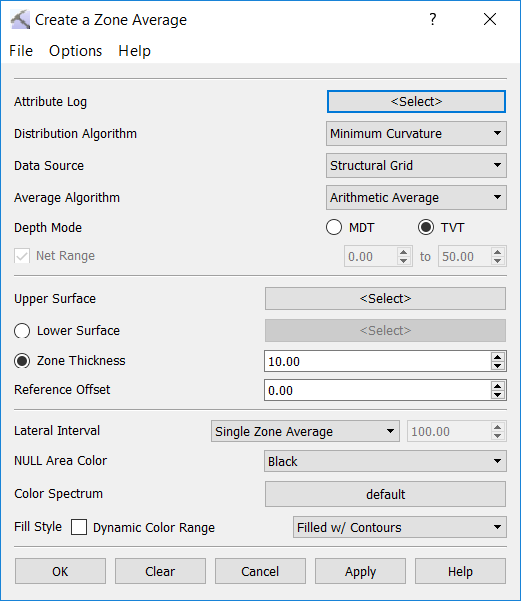
The Create a Zone Average window is used when you want to output a single representative value calculated from multiple log curve values over a defined range, that can be distributed across the reservoir. From this dialog box you will define the range of the interval, select the input data and method of calculation, and determine how it will appear in the Map View window. To open the Create a Zone Average dialog box, one the Buttons toolbar click  .
.
Menus
A series of menus are available at the top of the dialog box to access additional tools and options.
File Menu: Use the File menu to save, and export fault sets. ![]() See File menu options...
See File menu options...
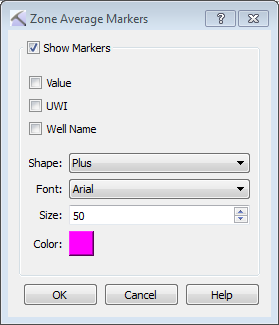
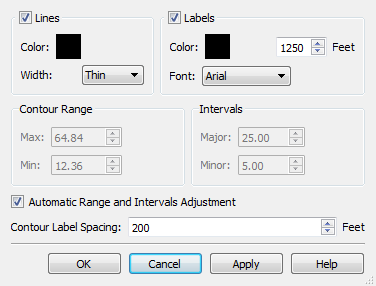
Options Menu: Use the Options menu to change gridding parameters, and adjust the marker and contour display controls. ![]() See Options menu options...
See Options menu options...
Grid and Average Calculations
Attribute Log: Click to open the Select Curve Data dialog box and select the log curve or substitute curve to be averaged. The zone average map will be scaled and colored using the minimum and maximum values defined for each attribute log.
Distribution Algorithm: Select the algorithm that will be used to create the zone average surface. ![]() See Distribution Algorithms.
See Distribution Algorithms.
Data Source: Select the method that will be used to generate the surface grid.
Structural Grid: Zone average values will be calculated in those wells where both the top and the base structural surfaces are present. Zone average values are calculated in the intervals defined by the intersection of the top and base structural surfaces with the wells in the project.
Well Picks: Zone average value is calculated only for those wells which have both the specified top and base surface picks. This pointset is then gridded and the resulting zone average map is shown in the Map View.
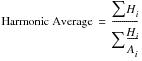
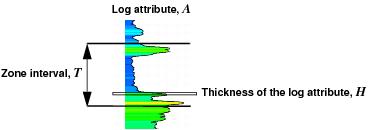 Average Algorithm: Select the method that will be used to determine the zone average value at the well location. In the following definitions A represents the attribute value, T represents the thickness of the zone interval, and H represents the thickness of the log attribute.
 ![]() See Average Algorithms...
See Average Algorithms...
Depth Mode: Select the depth mode to use to determine how the thickness measurements will be made.
MDT: Measured depth thickness measurements are taken along the well bore.
TVT: True vertical thickness measurements are taken vertically. Note that for vertical well the MDT and TVT values are the same, but for deviated wells they may be significantly different.
Net Range: Specify the range of log curve values to use in the Net or Net-to-Gross averaging calculations. Note: These values are limited to the MIN and MAX values of the Attribute Log selected, for all wells in the project.
Zone Average Interval
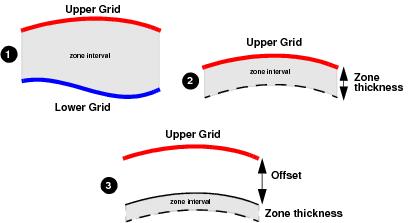 There are three methods for determining the zone average interval using an upper and lower surface, and upper surface and a thickness, or an upper grid, an offset and a thickness.
Upper Surface: Click to open the Choose One Surfacedialog box and select the upper surface.
Lower Surface: Click to open the Choose One Surface dialog box and select the upper surface.
Zone Thickness: Enter a Zone Thickness and optionally a Reference Offset in depth units.
Display Options
Enter the parameters to determine how the zone average surface will appear on the map.
Lateral Interval: Specify the number of zone average values to extract along the interval.
Single Zone Average: Calculate one zone average over the interval. This is the default and is should be used for straight and deviated wells that will enter and exit the zone once. When this is used on horizontal wells that enter and exit the zone several times, a zone average value is calculated each time the well enters and exits the zone and each well path segment in the zone will have a zone average marker in Map View.
MD: Calculate a series of zone averages based on a user-specified sampling distance along the measured depth of the well trajectory. This is typically used for horizontal wells that enter the zone once and remain within the zone for some distance. Enter a value for the sampling distance in the field provided. In Map View, the spacing of the zone average markers will vary from well to well due to differences in orientation of the well trajectories.
XY: Calculate a series of zone averages based on a user-specified sampling distance in the XY plane along the well trajectory. This is typically used for horizontal wells that enter the zone once and remain within the zone for some distance. Enter a value for the sampling distance in the field provided. In Map View, the zone average markers appear uniformly spaced from well to well.
NULL Area Color: Select a color to represent area where there is no data for the interval. Choose from White, Gray, or Black.
Color Spectrum: Open the Color Spectrum Manager to select or change the color spectrum for the surface.
Fill Style: Specify how the surface should appear in the display. Choose from Filled, Filled with Contours, or Contours.
Dynamic Color Range: When this is turned on, the color spectrum range adjusts to the data range, so that the whole spectrum is used over the range of data. Use this option when the numerical range of data values is much smaller than the values set for the spectrum.
— MORE INFORMATION

|
Copyright © 2020 | SeisWare International Inc. | All rights reserved |