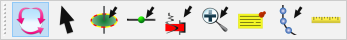
Map View Toolbars: Mode
The Mode toolbar is used to enter different modes, allowing your cursor to interact with the 3D display in different ways. For example, you can enter Pick mode to make and modify surface picks, or Measurement mode, to measure or annotate distances. By default, the Mode toolbar is docked on the top, left corner of the Map View window.
Movement mode is the default mode in the Map View window. It is used to pan and zoom the display. When you are in Movement mode, your cursor will look like a four-sided arrow (![]() ). To pan, zoom, and rotate the display when you aren't in Movement mode, press the Control key on the keyboard, and manipulate the display as if you were in Movement mode.
). To pan, zoom, and rotate the display when you aren't in Movement mode, press the Control key on the keyboard, and manipulate the display as if you were in Movement mode.
| How Do I...? | |
|---|---|
| Zoom In | Click and drag the mouse towards yourself. |
| Zoom Out | Click and drag the mouse away from yourself. |
| Pan | Right click and drag the mouse in the desired direction. |
Use Select Object mode to select wells and open the View Well dialog box, where you can view well information. When you right click on an object you will have access to a shortcut menu, used to access many of the tools available from the menus and toolbars, and additional tools specific to the data object. When you are in Select Object mode, your cursor will look like a hand (![]() )
)
Use Pick mode to select, edit, and add individual well picks. When you are in Pick mode, your cursor will look like a vertical arrow (![]() ). Note that he cursor will behave differently when you have Quick Pickturned on.
). Note that he cursor will behave differently when you have Quick Pickturned on.
Pick Mode: Click on the well path or log curve to open the Well View and Pick Information windows. From here you can add and edit well picks, and adjust their properties.
Quick Pick Mode: When this has been turned on in the Pick Controls dialog box, Click on the well stick or log curve to place a pick. To edit a pick, click on the pick and drag it to a new location.
Open the Edit Inter-Well Picks dialog box do add and edit inter-well picks. Note that to add inter-well picks, you need to display the associated surface. To edit inter-well picks, you need to display the existing inter-well pick.
In Select Well mode you can select or deselect individual wells by clicking on the well symbol. When you are in Select Well mode, your cursor will look like an arrow (![]() )
)
In Lasso Select mode you can graphically select a group of wells using a polygon. Make a series of clicks to create the polygon, and then right click when you are finished to close the polygon. All of the wells within the polygon will be selected. Note: This will not deselect any wells outside of the polygon. When you are in Lasso Select mode, your cursor will look like a plus sign (![]() ).
).
In Rectangle Select mode you can graphically select a group of wells using a rectangle. Left click and drag to create the rectangle, and then release the mouse when you are finished. All of the wells within the rectangle will be selected. Note: This will not deselect any wells outside of the polygon. When you are in Rectangle Select mode, your cursor will look like a plus sign (![]() ).
).
Enter Rectangular Zoom mode, click and drag a rectangle around the area you are interested in, and then release the mouse button to graphically zoom the display. The scale will not change, meaning that the zoomed display may contain more data than was contained in the rectangle you selected. After zooming in on the display, you will revert to Movement mode. When you are in Rectangular Zoom mode, your cursor will look like a plus sign (![]() ).
).
To graphically set the display limits for the project, click and drag out a rectangle, and then release the mouse button. The display limits define the area over which a structure grid, an isochore map, or a zone average map is displayed, and must be a subset of the project limits.
Changing the display limits in Map View will change the display limits for the entire project, but will not affect the project limits. To define the display limits manually, open the Limits dialog box from the Buttons toolbar.
When you are setting the display limits, your cursor will look like a plus sign (![]() ).
).
To graphically set the limits for the project, click and drag out a rectangle, and then release the mouse button. The project limits define the area over which data is used to create surface maps and sections.
Changing the project limits in Map View will change the project limits throughout the project, and also reset the display limits to match the project limits. To define the project limits manually, open the Limits dialog box from the Buttons toolbar.
When you are setting the project limits, your cursor will look like a plus sign (![]() ).
).
Open theDrilling Target Identifier dialog box to plan a well.
Use Measurement mode to measure distances and angles on your display. When you are in Measurement mode, your cursor will look like a vertical arrow (![]() ).
).
Click on the cross section to begin. As you move your cursor, distance and angle measurements will appear in the status bar. As you make successive clicks the Dist field displays the total distance, and the Angle field displays the angle from horizontal between your cursor location and the last node.
When you are finished with your measurement, right click and select Save Measurement as Annotation. This will create one or multiple measurement annotation objects, displaying both the distance and the angle, using the default annotation properties.
— MORE INFORMATION

|
Copyright © 2020 | SeisWare International Inc. | All rights reserved |