Seismic Tools: SEGY Analyzer for 2D Data
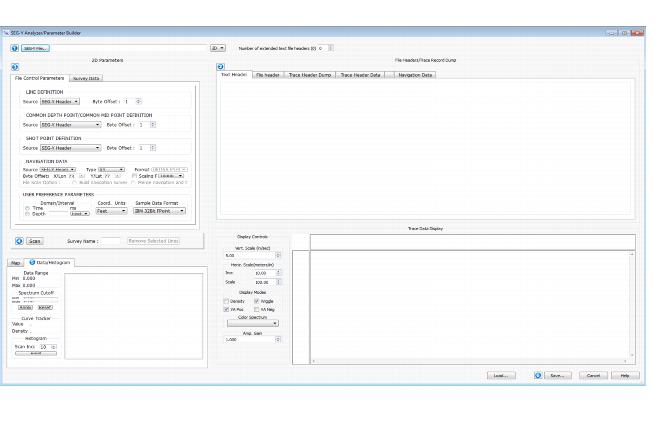
The SEG-Y Analyzer is used to create a parameter file that is used to display 2D and 3D SEG-Y data in your project. You can open the SEG-Y Analyzer from the SEG-Y tab in both the 2D Seismic Data Controls and 3D Seismic Controls windows, and the Data tab in the Map View Seismic Controls window. There are numbered steps in the dialog box to help you analyze the data and build a parameter file.
Note: SEG-Y data must be in 32 bit format to be viewed in your project, and 3D files must be padded.
Step 1: Load SEG-Y File
Select the file and specify the geometry.
 SEG-Y File: Select a SEG-Y file (*segy, *.sgy). Note: SEG-Y data must be in 32 bit format to be viewed in your project, and 3D files must be padded.
Data Geometry: Select 2D to indicate the geometry of the file you are loading.
Step 2: File Header/Trace Record Dump
Examine the header information. Look for at the Text Header, File Header, and Trace Header Dump tabs to see the data contained within the file.
Text Header: View the EBCDIC header from the file.
File Header: View the binary header information from the file.
Trace Header Dump: View the trace header values to identify the line, trace, and coordinate offsets.
Column Header: Display the column headers as offsets, useful when completing Step 3: 3D Parameters, or as standard format, which displays the name of the standard SEG-Y information stored at each offset.
Line and Trace Byte Offsets: This option is only used when loading 3D data.
Header Records: Quickly view the first or last trace header record and navigate through the data.
Trace Header Data: View the trace header data. In this table, numeric code values are converted to text when applicable.
Step 3: 2D Parameters
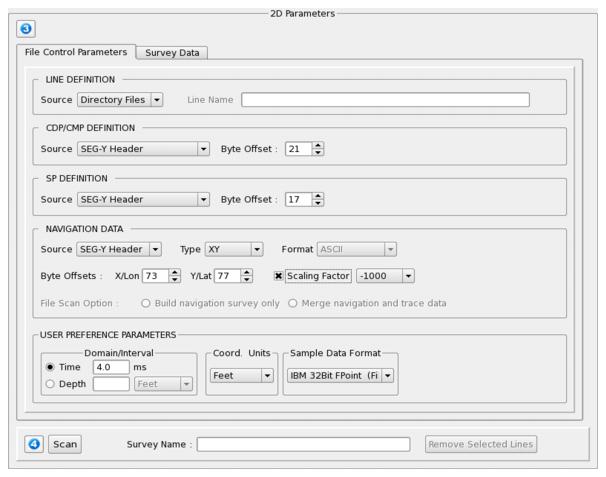 Enter the byte offset locations for the line definition, CDP, shotpoint, and coordinate data, and then specify the domain parameters and trace data format.
Line Definition: Specify the source for the line.
SEG-Y Header: The line name is listed in a specify byte offset. This is useful when one SEG-Y file contains multiple files.
User Defined: Enter a Line Name. If you are using a separate navigation file, this name must match exactly.
Data File: The line name is the same as the file name.
Directory Files: The line name is the same as the file name for all of the files in the directory. Use this to create one parameter file multiple files.
Common Depth Point/Common Mid Point Definition: Specify the byte location for the CDP, or manually define the CDP values.
SEG-Y Header: Enter the Byte Offset for the CDP values.
User Defined Expression: Enter the initial CDP value and then complete an expression to define subsequent values.
Shot Point Definition: Specify the byte location for the shot point values, or manually define the shot point values.
SEG-Y Header: Enter the Byte Offset for the shot point values.
User Defined Expression: Enter the initial shot point value and then complete an expression to define subsequent values.
Navigation Data: Select the source for the coordinate information.
SEG-Y Header: Enter the Byte Offset for the both the X and Y coordinates.
Scaling Factor: Place a check mark and then specify a scale factor to be applied to the X and Y coordinate. A negative value indicates division.
Disk File: Click  and select an ASCII, SEGP1, or UKOOA P1/90 navigation file. If you are just viewing navigation data and do not need to scan the data with a SEG-Y file, select File Scan Option: Build navigation survey. If the file needs to be merged with a SEG-Y file, select File Scan Option: Merge navigation and trace.
User Preference Parameters: Adjust the parameters if necessary.
Domain/Interval: Select the domain and manually enter the sample interval.
Coordinate Units: Specify the units of the coordinates in the file. This will default to project units.
Sample Data Format: Select the correct format for the sample data in the file. Use the Trace Data Display to verify your choice.
Step 4: Check Data and Scan File
 Scan: Scan the file to populate the Data Extents, and Survey Coordinates fields.
Survey Name: Enter a name for the seismic file. This can be used to easily identify the volume in your project.
Step 5: Build Data Histogram
Click  to scan the trace data in the file, and build a histogram of trace data values. Use this information to adjust the Spectrum Cutoff values, and to remove extreme amplitude values from the display.
Data Range: After you click the minimum and maximum data values found in the file are displayed.
Spectrum Cutoff: Manually enter spectrum cutoff values, or drag your cursor on the histogram to set minimum and maximum values. Any data values outside of the cutoff range are assigned the minimum or maximum amplitude values.
Curve Tracker: Place your cursor on the histogram to view the amplitude values and the number of samples containing that value.
Histogram: Select a Scan Increment and click . The scan increment represents the range in amplitude values included in each interval.
Step 6: Quality Check and Save
Before you save the parameter file, verify your settings by looking at the trace data display for each line. First, click on the Survey Data tab, and then select a line. The line will display in the Trace Data Display area. Once you have confirmed that your settings are correct, click  to save the parameters file with either a .sgyp or .segyp extension. If the setting aren't correct for a specific line, select the line on the Survey Data tab, and click
  . These lines will not be included in the parameter file.
Display Controls: Adjust the display parameters to preview the seismic data.
 Load: Load an existing parameter file (.sgyp or .segyp) to check or modify the parameters.
Save: Save the current parameters to a parameter file (.sgyp or .segyp). This file is only valid for the SEG-Y file for which is was created.
-
Click
 to create a cross section that corresponds to the line you want to display.
 -
In the 3D View window, click
 .
. -
Place a check mark in the Seismic Backdrop column. The color spectrum and opacity filter can be changed or edited from the 2D Seismic Data Controls dialog box.
-
Click
to create a cross section that corresponds to the line you want to display. -
In the Cross Section View window, click
 . This will open the Cross Section Seismic Backdrop dialog box.
-
In the Map View window, click
 .
. -
Click on the 2D Seismic tab. (This is the Drop-down text)
— MORE INFORMATION

|
Copyright © 2020 | SeisWare International Inc. | All rights reserved |