Seismic Tools: SEGY Analyzer for 3D Data
The SEG-Y Analyzer is used to create a parameter file that is used to display 2D and 3D SEG-Y data in your project. You can open the SEG-Y Analyzer from the SEG-Y tab in both the 2D Seismic Data Controls and 3D Seismic Controls windows, and the Data tab in the Map View Seismic Controls window. There are numbered steps in the dialog box to help you analyze the data and build a parameter file.
Note: SEG-Y data must be in 32 bit format to be viewed in your project, and 3D files must be padded.
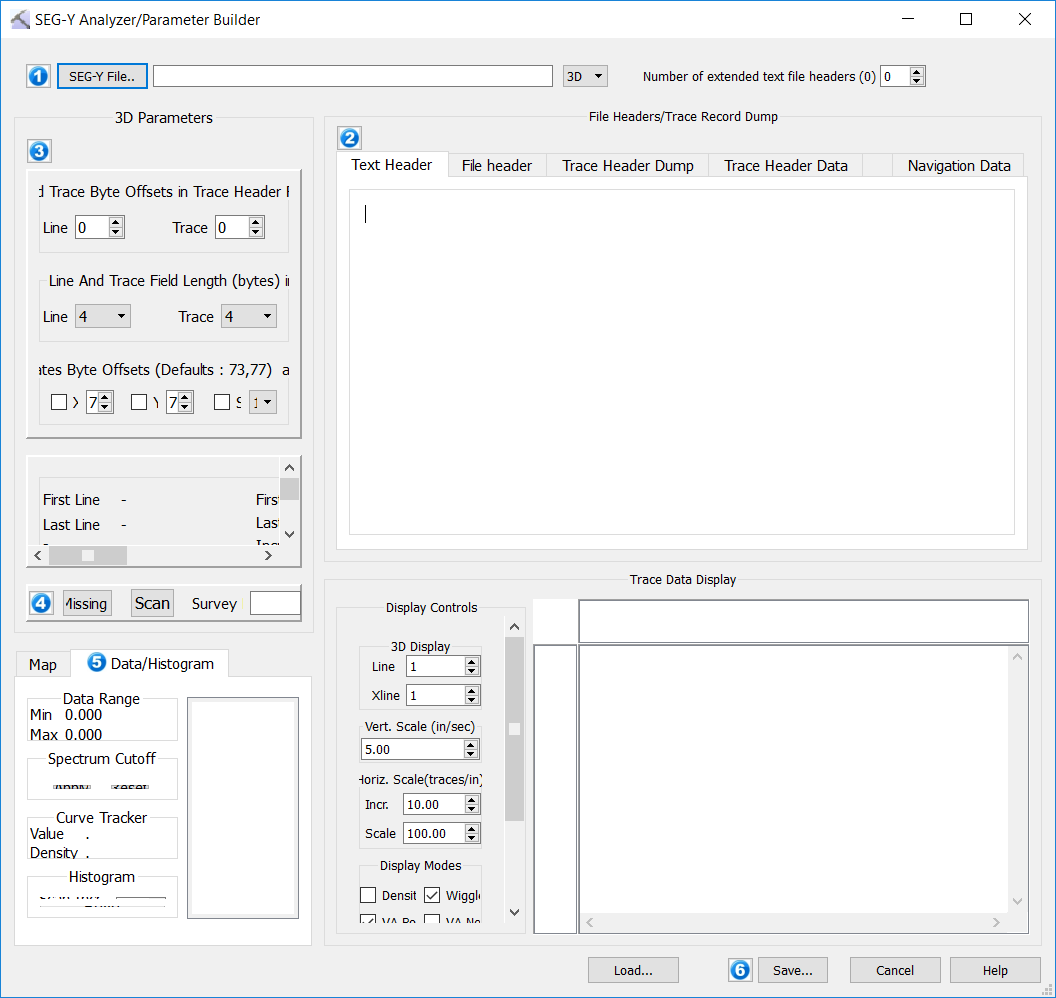
Step 1: Load SEG-Y File
Select the file and specify the geometry.
 SEG-Y File: Select a SEG-Y file (*.segy, *.sgy). Note: SEG-Y data must be in 32 bit format to be viewed in your project, and 3D files must be padded.
Data Geometry: Select 3D to indicate the geometry of the file you are loading.
Step 2: File Header/Trace Record Dump
Examine the header information. Look for at the Text Header, File Header, and Trace Header Dump tabs to see the data contained within the file.
Text Header: View the EBCDIC header from the file.
File Header: View the binary header information from the file.
Trace Header Dump: View the trace header values to identify the line, trace, and coordinate offsets.
Column Header: Display the column headers as offsets, useful when completing Step 3: 3D Parameters, or as standard format, which displays the name of the standard SEG-Y information stored at each offset.
Line and Trace Byte Offsets: Automatically locate the line and trace offsets in the trace header data, and apply this information to Step 3: 3D Parameters.
 Search: Automatically search the header for the probable location of the line and trace values. The probably line values will be highlighted in pink, and the probably trace values in green.
 Apply: Enter the line and trace offset values into the Line and Trace fields in Step 3: 3D Parameters.
Header Records: Quickly view the first or last trace header record and navigate through the data.
Trace Header Data: View the trace header data. In this table, numeric code values are converted to text when applicable.
Step 3: 3D Parameters
Enter the byte offset locations for the line, trace, X coordinate, and Y coordinate and then scan the file to verify the data extents and corner locations in the file, and to modify the sample rate and data format for the trace data contained in the file.
Line and Trace Byte Offsets in Trace Header Rows: Check that the line and trace byte offset locations are correct.
Line: Enter the byte offset of the line sequence number. This can be populated automatically by clicking in Step 2.
Trace: Enter the byte offset of the trace sequence number. This can be populated automatically by clicking in Step 2.
Line and Trace Field Length (bytes) in Trace Header Records: Enter the length in bytes of the line and trace values in the trace header. This defaults to 4.
Optional Coordinates Byte Offsets and Scaling Factor: By default the program is looking for coordinate information in byte offsets 73 (X) and 77 (Y).
XC: Place a check mark and enter the byte offset location of the X coordinate.
YC: Place a check mark and enter the byte offset location of the Y coordinate.
Scaling Factor: Place a check mark and then specify a scale factor to be applied to the X and Y coordinate. A negative value indicates division.
Data Extents: Click  and verify that the data extents for the file are correct. Look at the Map tab in Step 5 to confirm that the geometry of the file looks right.
User Preference Parameters: Adjust the parameters if necessary.
Domain/Interval: Select the domain and manually enter the sample interval.
Coordinate Units: Specify the units of the coordinates in the file. This will default to project units.
Sample Data Format: Select the correct format for the sample data in the file. Use the Trace Data Display to verify your choice.
Time Delay: Enter a value in milliseconds, to indicate the start time of the trace data in the file.
Survey Coordinates: Click and verify that the corner coordinates of the file are right. Click on the Map tab to verify the geometry of the file.
Step 4: Check Data and Scan File
 Check Missing Data: Scan the file to verify that there is no missing header information that will prevent the file from being loaded.
Scan: Scan the file to populate the Data Extents, and Survey Coordinates fields.
Survey Name: Enter a name for the seismic file. This can be used to easily identify the volume in your project.
Step 5: Build Data Histogram
Click  to scan the trace data in the file, and build a histogram of trace data values. Use this information to adjust the Spectrum Cutoff values, and to remove extreme amplitude values from the display.
Data Range: After you click the minimum and maximum data values found in the file are displayed.
Spectrum Cutoff: Manually enter spectrum cutoff values, or drag your cursor on the histogram to set minimum and maximum values. Any data values outside of the cutoff range are assigned the minimum or maximum amplitude values.
Curve Tracker: Place your cursor on the histogram to view the amplitude values and the number of samples containing that value.
Histogram: Select a Scan Increment and click . The scan increment represents the range in amplitude values included in each interval.
Step 6: Quality Check and Save
Before you save the parameter file, verify your settings by looking at the trace data display. Then click  to save the parameters file with either a .sgyp or .segyp extension. This parameter file is for this SEG-Y file only. Click
  to open and modify an existing parameter file.
Display Controls: Adjust the display parameters to preview the seismic data.
Load: Load an existing parameter file (.sgyp or .segyp) to check or modify the parameters.
Save: Save the current parameters to a parameter file (.sgyp or .segyp). This file is only valid for the SEG-Y file for which is was created.
— MORE INFORMATION

|
Copyright © 2020 | SeisWare International Inc. | All rights reserved |