Map View Tools: Map View Display Controls
The Map View Display Controls dialog box is used manage general display properties, control the appearance of wells and templates, determine which layers are actively being displayed in the Map View window. To open the Map View Display Controls dialog box, on the Buttons toolbar click  , or from theView menu select Map Controls, and then choose General, Layers, Wells, 2D Seismic, 3D Seismic, Titles, or Legend.
Tabs
There are eight tabs, used to set the display properties in the Map View window.
Wells Tab: Specify the appearance of wells on the map, including deviated well paths, labels, and symbols size and appearance.  See Wells tab options...
Wells Tab Options
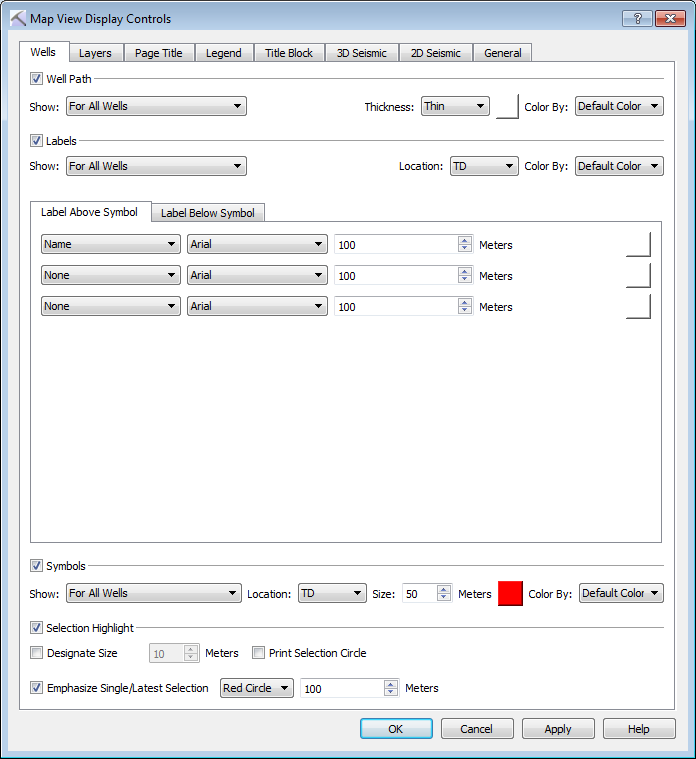 Well Path: Turn on the well path display for the specified wells using the selected options .
Show: Determine for which wells the well paths will be drawn. Choose from For All Wells, For Selected Wells, For Wells Inside the AOI, For Highlighted Wells, and For Dynamic Cross Section Wells. The AOI) is specified on the Display tab in the Limits dialog box.
Thickness: Specify the thickness of the well path displays. Choose from Thin, Medium, and Thick.
Well Path Color: Click on the color field to open the Color Table to select or change the default color for the well path displays.
Color By: Override the default to color apply color using the well Group, or Status.
Labels: Turn on well labels for the specified wells using the selected options .
Show: Determine for which wells the labels will be drawn. Choose from Choose from For All Wells, For Selected Wells, For Wells Inside the AOI, For Highlighted Wells, and For Dynamic Cross Section Wells. The AOI) is specified on the Display tab in the Limits dialog box.
Location: Determine the location of the labels. Choose from TD, KB, and TD and KB.
Color By: Override the default to color apply color using the well Group, or Status.
Label Above/Below Symbol: Select the well properties to display above or below the well symbols in the display, using the appropriate tab, and determine how they will appear.
Name: Select the well property that you want to appear above or below the well symbols on the display. Labels will be written in the same order on the map that they appear on the selection tab.
Label Font: Select a font style from the list.
Label Font Size: Specify or edit the font size for the label in map units relative to the well display.
Label Color: Click on the color field to open the Color Table to select or change the default color for the well labels.
Symbols: Turn on symbols for the specified wells using the selected options .
Show: Determine for which wells the well paths will be drawn. Choose from For All Wells, For Selected Wells, For Wells Inside the AOI, For Highlighted Wells, and For Dynamic Cross Section Wells. The AOI) is specified on the Display tab in the Limits dialog box.
Location: Determine the location of the symbols. Choose from TD, KB, and TD and KB.
Symbol Size: Specify or edit the font size for the label in map units relative to the well display.
Symbol Color: Click on the color field to open the Color Table and select or change the default color for the well symbols.
Color By: Override the default to color apply color using the well Group, or Status.
Selection Highlight: Place a circular marker around the well symbol to indicate a well has been selected.
Designate Size: Specify the size of the selection highlight in map units relative to the map display. If this is not turned on the Symbol Size is used.
Print Selection Circle: Include the selection highlight on the hardcopy.
Emphasize Single/Latest Selection: Add a marker to most recently selected well. Choose from Circle or Flag.
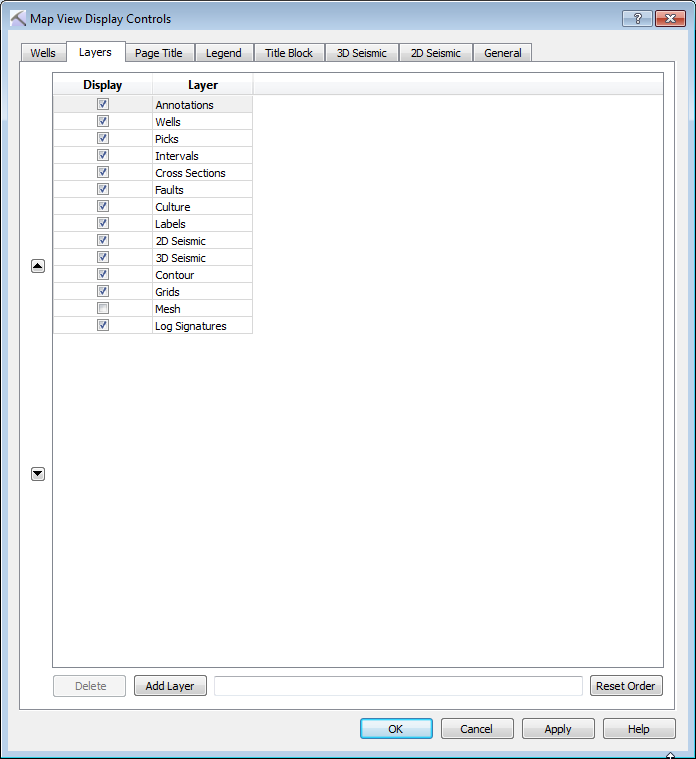
Layers Tab: Use the Layers tab to turn layers on and off, create new layers, and order the layers on the map. See Layers tab options...
Layers Tab Options
Display: Place a check mark next to the layers that you want displayed in the map.
 Move Selected Layer Up: Move the selected layer higher in the layers list. The order that layers appear in this list is the order in which they are drawn.
 Move Selected Layer Down: Move the selected layer lower in the layers list. The order that layers appear in this list is the order in which they are drawn.
 Delete: Delete the selected user-defined layer. You can only delete layers if they were created by a user.
 Add Layer: Enter a name in the text field, and then click this button. This will add a layer to the cross section display, which can be used to group annotations and culture, making them easier to manage.
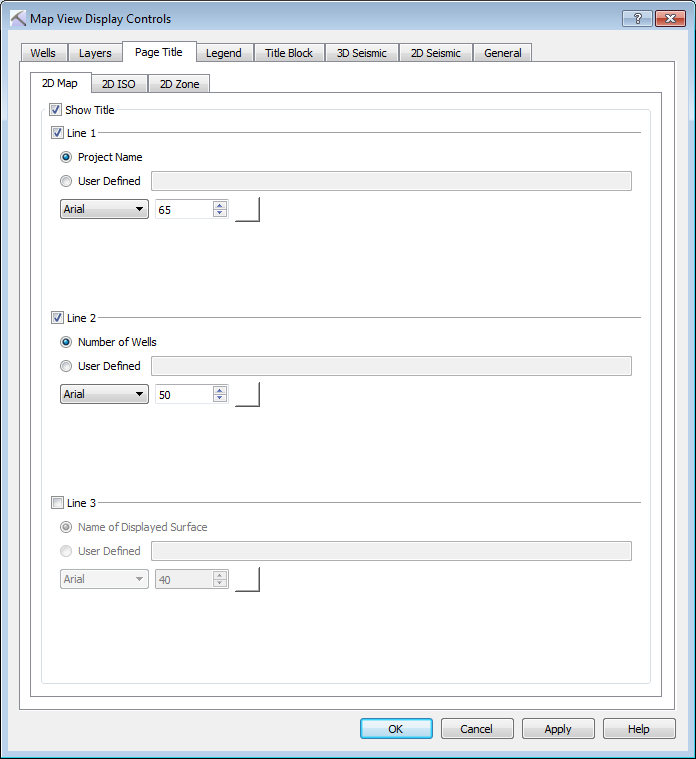
Page Title Tab: Use the Page Title tab to create and manage the title that will appear at the top of the map display. There are three tabs (2D Map, 2D ISO, and 2D Zone) which contain the same options, but allow you to display different title information depending on the type of surface you are displaying (surface, isochore, or zone average). Note that the page title can't be moved, it is centered at the top of the map display. See Page Title tab options...
 Page Title Tab Options
Show Title: Display the title when you are displaying data corresponding to the current tab.
Line 1: Display the Project Name, or enter the text in the User Defined field that you want displayed on the first line of the page title.
Line 2: Display the Number of Wells, or enter the text in the User Defined field that you want displayed on the second line of the page title.
Line 3: Display the Name of Displayed Surface, or enter the text in the User Defined field that you want displayed on the third line of the page title.
Title Font: Select a font style from the list.
Title Font Size: Specify or edit the font size for the title in map units relative to the well display.
Title Font Color: Click on the color field to open the Color Table to select or change the default color for the map title.
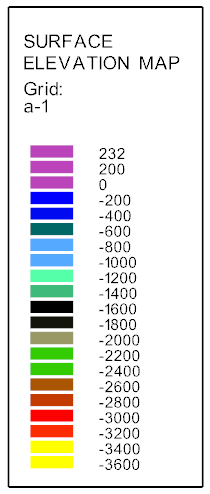
Legend Tab: Use the Legend tab to turn various legend elements on and off, including the Surface Legend, Scale Legend, North Arrow, and Scale Bars, and to set the Mesh appearance. See Legend tab options...
Legend Tab Options
 Reset All Legends: Restore all legend elements to their default positions. This will not affect size or color selections.
Surface Legend: Display the color spectrum of the currently displayed surfaced using the specified parameters. By default this will be displayed on the right side of your project area. You can drag the scale legend to a new location while in Movement mode. Note that this will not be visible when no surface is being displayed.
Size: Specify or edit the font size for the surface legend title in map units relative to the well display.
Foreground: Click on the color field to open the Color Table and select or change the foreground color, which is applied to the text and border.
Background: Click on the color field to open the Color Table and select or change the background color.
 Reset: Restore the surface legend to its default position.
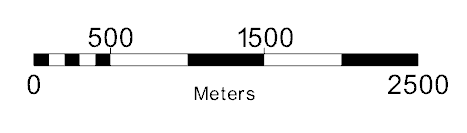 Scale Legend: Display a scale bar in map units. By default this will be displayed on the bottom right corner of your project area. You can drag the scale legend to a new location while in Movement mode.
Size: Specify or edit the font size for the scale legend title in map units relative to the well display.
Font Color: Click on the color field to open the Color Table and select or change the font color for the scale legend.
Scale Color: Click on the color field to open the Color Table and select or change the scale color for the scale legend.
Set Width: Turn this on to specify the width of the scale legend in map units.
Reset: Restore the scale legend to its default position.
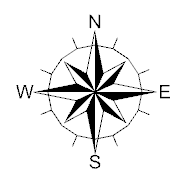 North Arrow: Display a north arrow on the map. By default this will be displayed on the on the bottom right corner of your project area. You can drag the north arrow to a new location while in Movement mode.
Size: Specify or edit the size of the north arrow in map units relative to the well display.
Color: Click on the color field to open the Color Table and select or change the color for the north arrow.
Style: Select a style for the north arrow. Choose from Sun Arrow, Plain Arrow (No Label), Plain North Arrow, Crosshair, or Classic Compass.
Reset: Restore the north arrow to its default position.
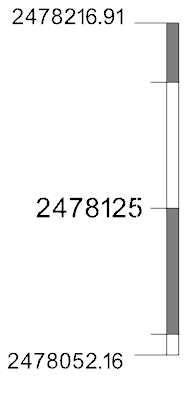 Scale Bars: Display scale bars around the area of interest (AOI). To turn all scale bars off, remove the check marks from Scale Left, Right, Top, and Bottom
Font Size: Specify or edit the font size for the scale bar in the appropriate units.
Font Color: Click on the color field to open the Color Table and select or change the font color.
Scale Width: Specify or edit the font size for the scale bar in the appropriate units.
Scale Color: Click on the color field to open the Color Table and select or change the scale bar color, including the fill color.
Scale Left/Right/Top/Bottom: When annotating rectangles, specify the location of the scale bar.
Show Min/Max Values at Ends of Scale Bars on All Four Corners: Display the location values at the ends of the scale bar.
Display Sub-Grades: Display minor tick marks between major tick marks at the distance specified in map units.
Margin: Add a margin between the line or rectangle and the scale bar. Choose from No Margin, Narrow, and Wide.
Alternating Color Bar: Fill the scale bar between alternate major tick lines.
Mesh:Specify how the mesh should appear on the map.
Scale (Axis) Mesh: Display the mesh the distance of the scale width.
Scale (Axis) Mesh Color: Click on the color field to open the Color Table and select or change the color of the mesh.
Column/Row: Display the mesh the distance of the columns and rows specified in the Limits dialog box.
Column/Row Mesh Color: Click on the color field to open the Color Table and select or change the color of the mesh.
Title Block: Use the Title Block tab to enter title block information, and manage its appearance. By default, the title block is centered at the bottom of You can drag the title block to a new location while in Movement mode. See Title Block tab options...
Title Block Tab Options
 Title Block: Turn the title block on or off.
Title: Select a title for the title block. Choose from a list of project attributes, or select User Defined and enter a title.
Line 1/2/3/4/5: Select from a list of project attributes, or select User Defined and enter up to 5 lines of title block text.
Font: Select a font style from the list.
Size: Enter a size for the text in the appropriate units.
Border: Click on the color field to open the Color Table and select or change the border color.
Text: Click on the color field to open the Color Table and select or change the text color.
Background: Click on the color field to open the Color Table and select or change the background color.
Logo Image: Turn this on and select a logo image to display in the title block. After selecting the image, click  .
.
3D Seismic Tab: Use the 3D Seismic tab to display and annotate loaded seismic data on the map display. See 3D Seismic tab options...
3D Seismic Tab Options
Seismic: Display and annotate seismic data.
Survey Annotation: Enter values to control where and how often annotation marking occur on the 3D seismic data.
Increment: Enter an increment value for Lines and Traces to indicate how often you want annotation to appear.
Type: Select the type annotation type. Choose from Multiple or Simple.
Show Boundaries: Turn this on to show annotation at the data boundaries, regardless of the increment.
3D Inline/Crossline Tracker: Display and annotate the seismic data currently displayed in the 3D View window.
AOI: Turn on the Survey, Volume or Data display and then use the sliders to move through the volume.
Mesh Color: Open the Color Spectrum Manager to select or change the color for the 3D seismic display.
2D Seismic Tab: Use the 2D Seismic tab to display and annotate the location of 2D seismic data in the Map View window. See 2D Seismic tab options...
2D Seismic Tab Options
2D Surveys: This shows a list of the 2D surveys available for display on the map.
Color: Open the Color Spectrum Manager to select or change the color for the 2D seismic line.
Style: Select a style for the displayed line. Choose from Line, Stipple 1, or Stipple 2.
Thickness: Select a thickness for the displayed line. Choose from Thin, Medium, or Thick.
2D Lines: Select the elements that should be displayed for each line.
Show Line: Display the seismic line on the map.
Show CDP: Display the CPD data on the map using the Global CDP Increment.
Show SP: Display the shot point data on the map.
Global CDP Increment: Enter the increment value to control how often CPD annotation is displayed.
Annotation Font: Select a font size for the 2D seismic line annotation.
General Tab: Use the General tab to set general display options including AOI controls and background colors. See General tab options...
General Tab Options
2D AND 3D Selections: Display selections made in the 3D View and Cross Section View windows.
Grid Outside Display Limits: Use information outside the display limits to create grids.
Grid Mask: Display an outline of the current grid mask on the map.
Cross Section Tracker: Display a marker showing the current location of the cursor in the Cross Section View window.
Only Display Inside AOI: Limit the images and culture lines that are visible based on the project display boundaries.
Display All Images/Culture Lines: Display all images/culture lines.
Display Only Images/Culture Lines Fully In AOI: Display any images/culture lines that are fully contained within the AOI boundaries.
Clip Images/Culture Lines by AOI: Clip any images/culture lines that are partially contained within the AOI to the display boundaries.
Display Full Images/Culture Lines Partially Outside AOI: Display all images/culture lines that are partially contained within the AOI in their entirety, and no images/culture lines that are not partially contained within the AOI.
Background Color: Open the Color Spectrum Manager to select or change the background color for the 2D View window.
AOI Color: Open the Color Spectrum Manager to select or change the color for AOI outline.
