Cross Section View Tools: Select Log Curve
The Log Curve Selection dialog box is used to select the templates and log curves that you want to display in your cross section, and adjust their scale and color spectrum settings. To open the Log Curve Selection dialog box, click  on the Buttons toolbar, or select Log Curves from the Edit menu.
In the Log Curve Selection dialog box, you can select as many templates and curves as you want, and then use the attribute arrows (![]() /
/![]() ) on the Actions toolbar to cycle through them. The width of the well templates and curves is controlled from the Wells tab in the Cross Section View Display Controls dialog box which you can open by clicking
) on the Actions toolbar to cycle through them. The width of the well templates and curves is controlled from the Wells tab in the Cross Section View Display Controls dialog box which you can open by clicking  on the Buttons toolbar.
Menus
There is a series of menus at the top of the dialog box to help you access additional tools.
File Menu: The File menus allows you to save your project settings, and access import and export options. ![]() See File menu options...
See File menu options...
Edit Menu: The Edit menu allows you to access the log display parameters, and to delete log curve data. ![]() See Edit menu options...
See Edit menu options...
Templates Tab
Use this tab to select the templates you want available for display.
Select: Place a check mark next to the templates you want to display. You can edit and add templates from the Well View window.
Curves Tab
Use this tab to select the curves you want available for display, and select the scale and color settings.
Select: Place a check mark next to the log curves you want to display in your cross section.
Log: The names of the log curves in the project, sorted alphabetically.
Log10: Place a check mark in this field to turn on log base 10 for non-linearly distributed log curve data, such as permeability and resistivity.
Discrete: Place a check mark in this field to display sparsely sample log data, such as core porosity and core permeability, as discrete polygons instead of a smoothed curve.
Style: Select the display style for the log curves. Note: In the Cross Section View window you are limited to the Polygon style.
Line: Display the log curve as a line, colored using the Spectrum selection. 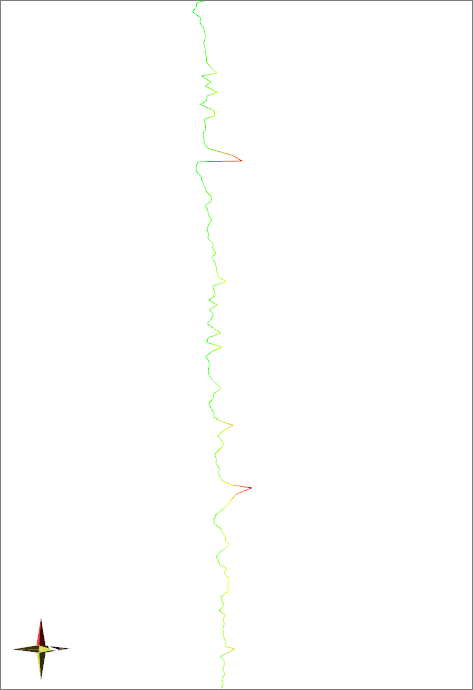
Polygon: Display the log curve as a filled line, colored using the Spectrum selection.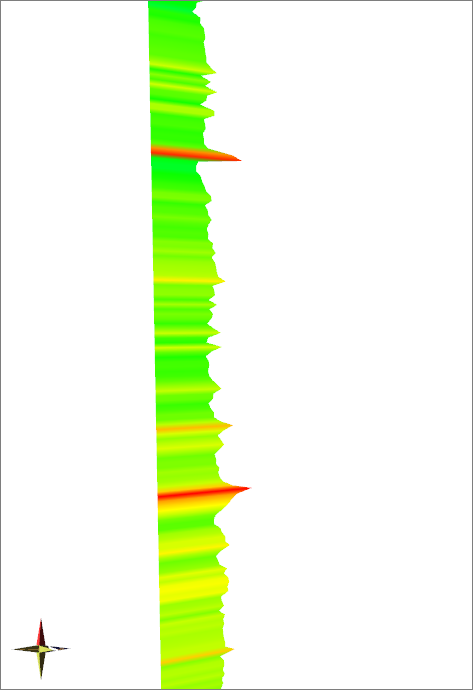
Cylinder: Display the log curve as a cylinder, colored using the Spectrum selection.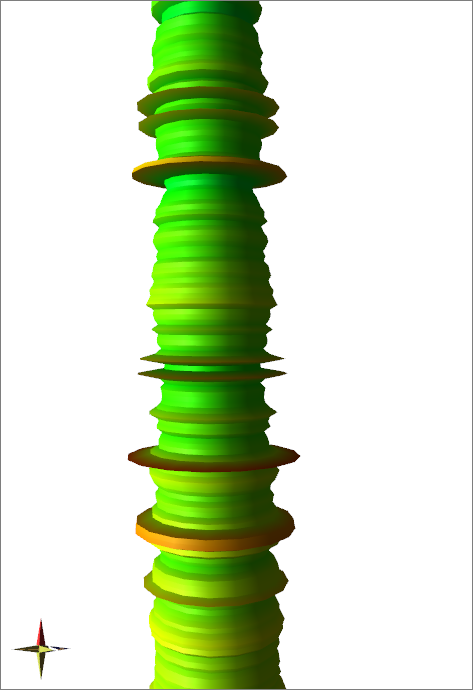
Scaling: Click in the cell to open the Log Data Range dialog box to define the Min and Max values for the curve display.
Min: The minimum value used to scale the log curve and color spectrum. This can be changed by clicking in the Scaling cell to open the Log Data Range dialog box.
Max: The maximum value used to scale the log curve and color spectrum. This can be changed by clicking in the Scaling cell to open the Log Data Range dialog box.
Spectrum: Click in the cell to open the Color Spectrum Manager dialog box to select a spectrum for the log curve display.
Log Data Range
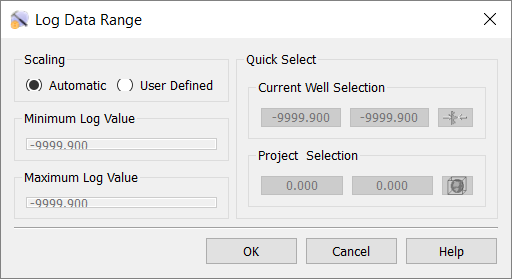 To change the Min or Max value for a specific log curve, click in the Scaling cell to open the Log Data Range dialog box.
Automatic: Assign the Min and Max values based on the minimum and maximum values in all logs of this type in the project.
User Defined: Assign the Min and Max values by entering Minimum and Maximum Log Value information.
Quick Select: Use the information and tools in this area to help determine a minimum or maximum data value.
Current Well Selection: The minimum and maximum value associated with the selected curve based the wells currently selected in Map View. Click the Snap to current well range icon (![]() ) to automatically place the Minimum and Maximum Log Value fields.
) to automatically place the Minimum and Maximum Log Value fields.
Project Selection: The minimum and maximum value associated with the selected curve based the wells currently selected in Map View. Click the Snap to project well range icon (![]() ) to automatically place the Minimum and Maximum Log Value fields.
) to automatically place the Minimum and Maximum Log Value fields.
— MORE INFORMATION

|
Copyright © 2020 | SeisWare International Inc. | All rights reserved |