Background Color: Click on the color field to open the Color Table and change the background color for 3D display.
Foreground Color: Click on the color field to open the Color Table and change the foreground color, which includes the model frame and scale markers.
Constant Rotation: When this is turned on, the 3D display will rotate continuously in the direction of the last manual rotation. The only way to disable this rotation is to turn this option off.
Cross Section Tracker: Turn on a marker showing the location of your cursor in the Cross Section window.
Map View Tracker: Turn on a marker showing the location of your cursor in the Map View window.
Frame Rate: Display the frame rate, or the number of graphics frames drawn per second (screen updates) to assess the performance of your project. Use this to determine if you should take steps to optimize the performance of your project.
Graphics Performance: Display the current graphics load, a measure of the system usage being taken up be graphics, on the status bar at the bottom of the window. Use this to determine if you should take steps to optimize the performance of your project.
Show Compass: Display a compass in the specified location to help orient the 3D display. Choose from Lower Left, Lower Right, Upper Right, or Upper Left.
Color Scale: Display on a small dialog box showing the color spectrum of a selected object as a cylinder, with its associated data values. You can also turn this on and change the selected object while in Color Spectrum Mode. By default this will be places on the top left corner of the 3D display.
Background Color: Click on the color field to open the Color Table and change the background color for Color Scale dialog box.
 Sync Background Color: Make the Background Color of the Color Scale dialog box the same as the Background Color for the 3D display.
Contrast: The Background Color will display lighter for higher contrast with the scale bar text.
 Reset: Return the color scale to t default position on the top left corner of the 3D display.
Color Style: Determine how colors are shown in the display.
Gouraud Shading: Color and shading is interpolated across polygons to give smoother images. In large projects, the additional processing may be significant.
Discrete Coloring: Display colors are shown without shading or interpolation. This method may also be called solid or flat.
Muted Colors: Display colors are toned down, making them less bright. This is often used when printing hard copies to reduce the ink saturation of the paper.
Hyperlinks: Turn hyperlink markers on or off. You can create a hyperlink marker while in Hyperlink Object Mode.
Show: Determine for which wells the hyperlink markers will be show. Choose from For All Wells and For Selected Wells.
Marker Size: Use the arrows or type in a value to scale the relative width of all the hyperlink markers in the 3D display.
Model Frame: Draw a frame in the Foreground Color showing the volume of interest (VOI) specified on the Display tab in the Limits dialog box.
Elevation Scale: Display the elevation in project units along the Z-axis of the model frame.
X & Y Scale: Display the X and Y values in project units along the X- and Y-axis of the model frame.
Elevation Plane: Display a translucent plane at a constant elevation. The elevation plane can be move up or down using the handle at the corner of the plane.
 , or from theView menu select 3D Controls, and then choose General, Wells, Color Style, Scaling and Rotation Preferences, or Lighting.
 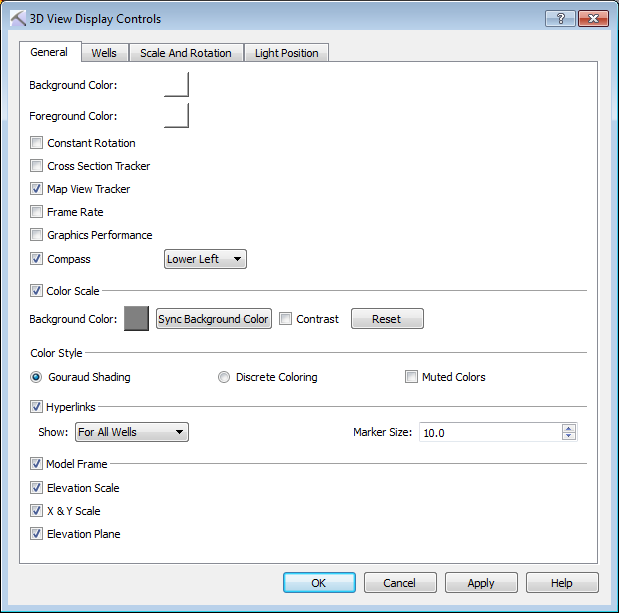 General Tab Options
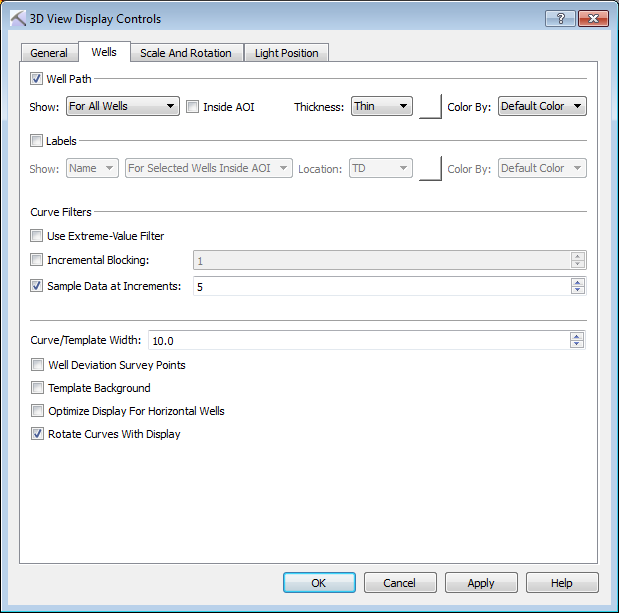 Wells Tab Options
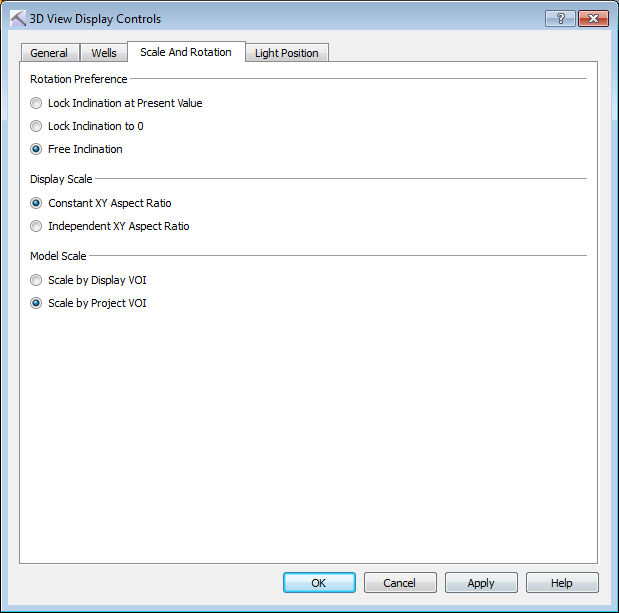 Scale and Rotation Tab Options
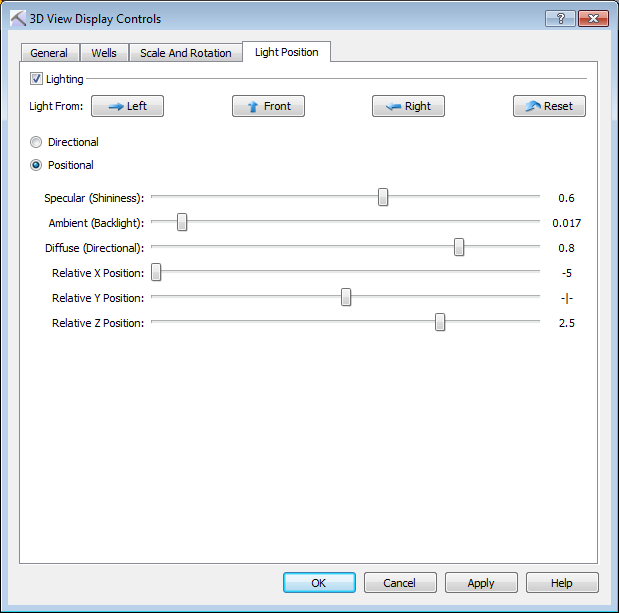 Light Position Tab Options
 to restore the light quality settings to their default positions.