Well View Tools: Template Edit Controls
The Template Edit Controls window is used to modify the appearance of a well template. Templates are used when displaying data in the 3D View window, Cross Section View window, and Well View window. Settings include choosing which logs to show in which track, the scale and range of data to show, and the style of the display. You can open this window by selecting Template Layout from the Edit menu in the Well View window.
There are four tabs to help you manage the display parameters—Tracks, Data, Depth, and Area Fill.
Tracks Tab
The Tracks tab is used to add tracks and adjust the scales and ranges for each track.
Add: Insert a blank row at the bottom of the table to create an additional track. Once you create a track, curves are then selected on the Data tab. Use the arrow buttons to change the order of the tracks.
Delete: Remove the selected track. To select a track, click on the row number in the left column.
Track Order: The order that the tracks appear in the list corresponds to the order they are drawn, from left to right. To change the position of a track, click on the track number in the left column and then use the arrow buttons (
/
) to move the row up or down in the list.
Column Headings
Track Type: Specify the track type. Select from Regular, Pick, Depth, or Image.Note: You can only have one Depth track for a template.
Track Name: Click in the table cell and enter or edit the track name. This is the name that will appear at the top of the log curve in the Well View display.
Width: Enter a value for the width or use the arrow keys to increase or decrease the width of the track.
Scale Type: Select a display scale, either Linear or Log10. When you select Linear you will also have to specify Lines/Decades. When you select Log10 you will also have to specify Mesh Start and Mesh Stop values.
Mesh Start / Mesh Stop: When you are using a Log10 scale, click to open the Left or RightTrack Range dialog boxes, and enter start (left) or stop (right) values for the log track scale. Enter a Track Value in the field provided at the top or click on the QuickSelect value provided in the table for the log curve type.
Lines/Decades: When you are using a Linear scale, enter a value to specify the number of scale divisions to display on the track. When you are using a Log10 scale, the value is entered automatically using your Mesh Start/Mesh Stop values.
Mesh Color: Select a color for the scale lines. To change the mesh color for a single track, click in the cell and select a color from the Color Table. To apply this color selection to all the tracks, click the column header, and then select a color for all tracks. The default color is black lines, on a white background.
Background Color: Select a background color for the track. To change the background color for a single track, click in the cell and select a color from the Color Table. To apply this color selection to all the tracks, click the column header, and then select a background color. The default color is a white background, with black lines.
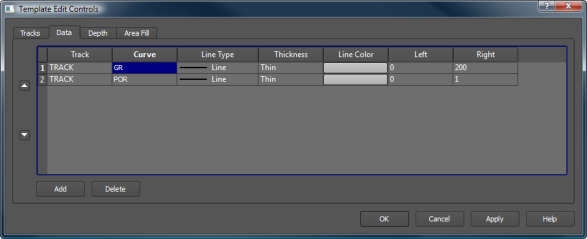
Data Tab
Use the Data tab to select the data to display in the tracks defined in the Tracks tab.
Track Order: When multiple curves are being displayed in a single track, the track order determines the order in which the scales appear at the top of the track, and the order in which the track are drawn in the template. To change the position of a track, click on the track number in the left column and then use the arrow buttons (
Data Tab Column Headings
Track: Select from the available tracks, as defined on the Tracks tab, to determine in which track the corresponding curve will be drawn.
Curve: Click to open the Select Curve Data dialog box, and select the data you want displayed in the track.
Line Type: Select a line style. Options include Line, Stipple 1, Stipple 2, Plus, Star, Circle, Diamond, and Dot.
Thickness: Select a line thickness. Options include Thin, Medium, and Thick
Line Color: Select a line color. Click in the cell and select a color from the Color Table.
Left/Right: Enter the left and right data values to determine the range of data to display, and the orientation of the curves.
Depth Tab
The options on the Depth tab control the appearance, scale, and content of the Depth track in your template.
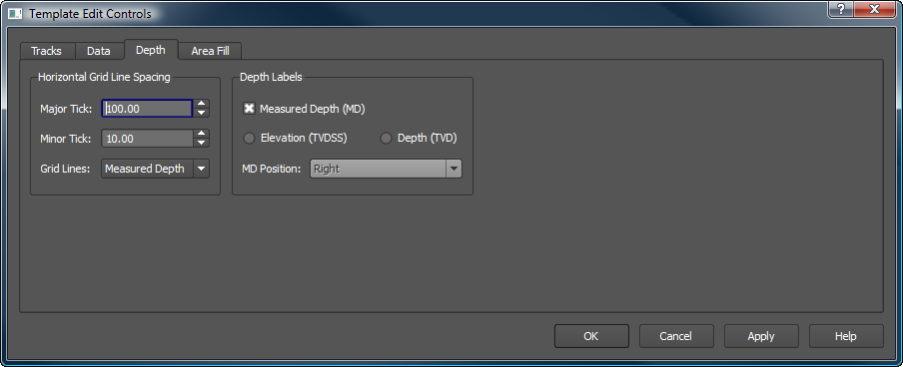
Horizontal Grid Line Spacing
Select the spacing for the horizontal grid lines being applied to the entire template.
Major Tick: Enter an interval in depth units used to draw the major horizontal grid lines.
Minor Tick: Enter an interval in depth units used the draw the minor horizontal grid lines. This works best when it is a multiple of the Major Tick value.
Grid Lines: Select which depth type to use to determine the spacing. Choose from MD (measured depth) and Elevation.
Depth Labels
Select the labeling method for the depth track.
Measured Depth: Display labels in measured depth. You can select Measured Depth as well as Elevation or Depth.
Elevation: Display labels in TVDSS. You can select Elevation and Measured Depth.
Depth: Display labels in TVD. You can select Depth and Measured Depth.
MD Position: When you are displaying Measured Depth as well as Elevation or Depth, indicate if you would like the Measured Depth labels drawn on the right or left side of the depth track.
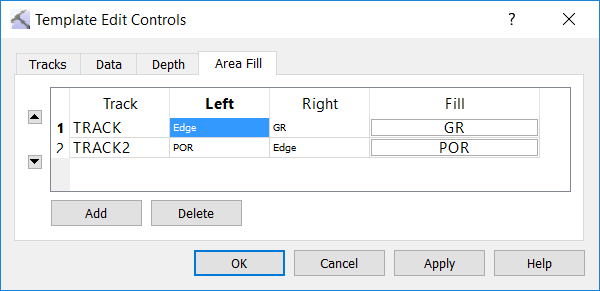
Area Fill Tab
Use the Area Fill tab to add fill colors and patterns to existing track data.
Track order: When multiple fills are being applied in a single track, the track order determines the order in which the fills are drawn. To change the position of a row, click on the row number in the left column and then use the arrow buttons (
Area Fill Tab Column Headings
Track: Select from the available tracks, as defined on the Tracks tab, to determine to which track the corresponding fill will be applied.
Left: Open the Select Left Track Edge dialog box to specify the left boundary of the fill. This can be set using a curve, interval, or constant value. The fill will only be applied between the left and right track edges.
Right: Open the Select Right Track Edge dialog box to specify the right boundary of the fill. This can be set using a curve, interval, or constant value. The fill will only be applied between the left and right track edges.
Fill: Open the Select Track Fill dialog box to select the fill you want applied between the left and right track edges.
Select Track Edge
Use the Select Left Track Edge and Select Right Track Edge dialog boxes to specify where the fill will be applied in the track.
Logs: Select from the list of available well logs to define the left or right edge of the fill.
Substitutes: When you have defined a substitute curve in the Substitute Curves dialog box, select from the list of substitute curves to define the left or right edge of the fill.
Intervals: Select the Interval Class or go to the appropriate tab and select the Interval Type.
Edge: Enter a Constant Cutoff value to define the left or right edge of the fill.
Select Track Fill
Use the Select Track Fill dialog box to determine the fill color. This can be based on log curve values or interval values, or a solid color can be applied.
Logs: Select from the list of available well logs to determine the fill color.
Raster Logs: Select from the list of available raster logs to determine the fill color.
Substitutes: When you have defined a substitute curve in the Substitute Curves dialog box, select from the list of substitute curves to determine the fill color.
Intervals: select the Interval Class or go to the appropriate tab and select the Interval Type.
Fill: Use a solid color and pattern for the fill, or turn on interval labels.
— MORE INFORMATION

|
Copyright © 2020 | SeisWare International Inc. | All rights reserved |