Grid and Contour: Anisotropy and Search Options
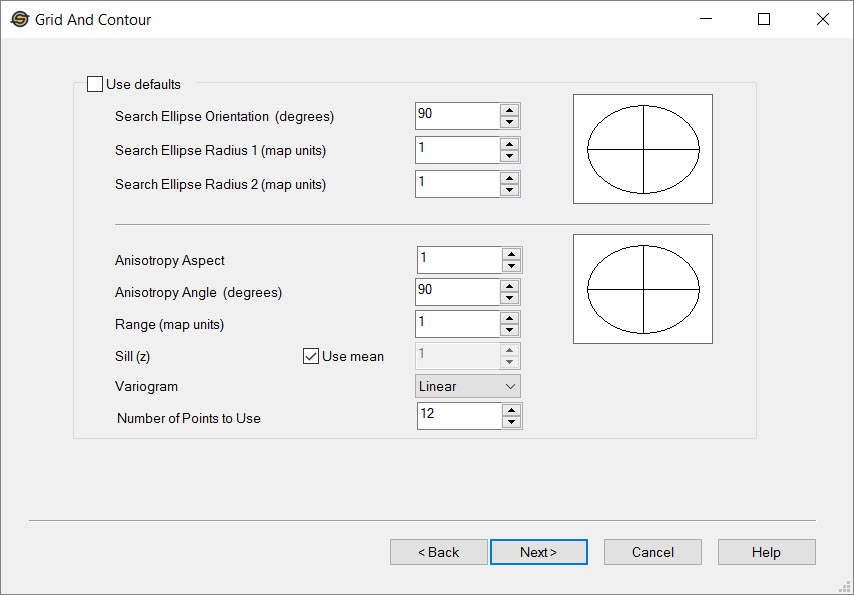
If a gridding technique that supports anisotropy (such as kriging or minimum curvature) was selected as the Gridding Technique this page will appear to specify the parameters for the Search Ellipse, Anisotropy Angle, Anisotropy Aspect, Range, Sill and Variogram.
Default Search Radius
Search Ellipse Settings
The search ellipse settings become available when you use the kriging, or nearest neighbor algorithm, and turn off Use defaults.
Search Ellipse Orientation: This value determines the orientation of a search ellipse around a central axis. The ellipse is created by entering Search Ellipse Radius 1 and 2 values. The orientation value should be between -360 and 360 degrees.
Search Ellipse Radius 1: Enter a value in map units that represents the X axis of the search ellipse.
Search Ellipse Radius 2: Enter a value in map units that represents the Y axis of the search ellipse.
Anisotropy Settings
The anisotropy and variogram settings become available when you use the kriging algorithm, and turn off Use defaults. Anisotropy settings are used to incorporate the directionality of the data into the calculation. Variogram settings are used to take the "roughness", or spacial continuity, of your data into account during the gridding process.
Anisotropy Aspect: The ratio between the major and minor axes of the ellipse that will be used, along with the angle, to change the weighting of the points that lie within this ellipse.
Anisotropy Angle: This angle will be used to change the weighting of the points that lie within the ellipse specified by the Anisotropy Aspect. The anisotropy angle should be between -360 and 360 degrees.
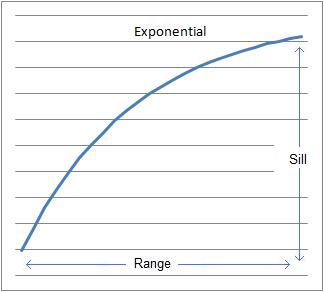
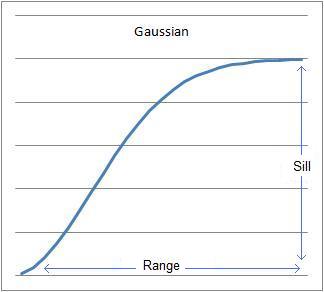
Range: The range represents the lag distance at which the variogram levels off. It is the greatest distance that two points on a surface are related to each other.
Sill: The sill represents the height at which the variogram levels off. It represents the difference between the values of the two points described in the range.
Use Mean: Use the average value of the data points instead of the difference between data values.
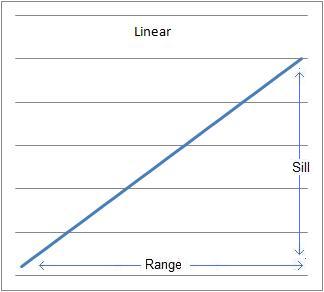
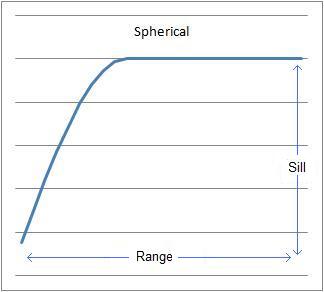
Variogram: Select the variogram that provides the best fit for your data. The variogram will be constructed using the values you entered in the Range and Sill fields, and used to determine the weighting of the data points in the gridding algorithm. Note: There are no tools within the software that allow you to calculate an experimental variogram to determine the best variogram to use for your data set.
Number of Points to Use: Specify the maximum number of data points to include when determining the final grid bin value. The higher this value, the longer the calculation will take. The default value is 12.
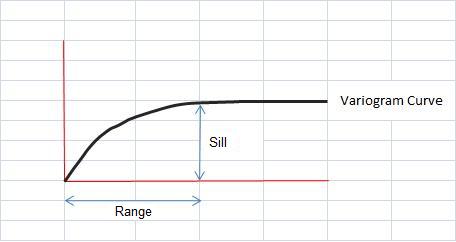
The following graphs show the different variogram functions.
Grid and Contour Wizard Options
— MORE INFORMATION

|
Copyright © 2020 | SeisWare International Inc. | All rights reserved |