Grid and Contour: Gridding Technique
Select the gridding technique to use for the grid and contour operation.
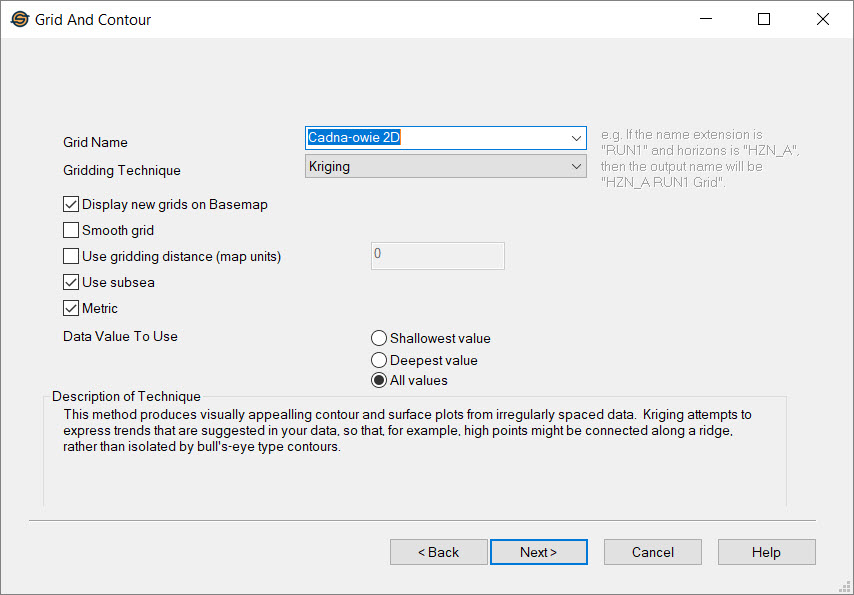
Grid Name
Name Extension: If gridding seismic interpretation data, enter in the name extension that will be added after the horizon name followed by the word 'grid'. If gridding well tops, enter in the name extension that will added after the formation name followed by the word 'grid'.
Grid Name: If gridding an existing contour this option will appear. Enter in the name that will be assigned to the grid.
Gridding Technique
Gridding Technique: Select the gridding algorithm to use
to grid
the data. A description for each algorithm is available at the bottom
of the dialog.
- Minimum
Curvature: Minimum Curvature is widely used in the earth
sciences. Minimum Curvature generates the smoothest possible
surface while attempting to honor your data as closely as possible.
Minimum Curvature is not an exact interpolator however.
This means that your data is not always honored exactly.
- Kriging-
Kriging produces
visually appealing contour and surface plots from irregularly spaced
data. Kriging attempts to express trends that are suggested in
your data, so that, for example, high points might be connected along a
ridge, rather isolated by "bull's-eye" type contours.
- Nearest Neighbor: The
Nearest
Neighbor gridding method assigns the value of the nearest datum point
to each grid node. This method is useful when the data is nearly
on a grid with only a few missing values, this method is effective for
filling in the holes in the data.
- Polynomial Regression: Polynomial
Regression is used to define large scale trends and patterns in your
data. Polynomial Regression is not really an interpolator because
it does not attempt to predict unknown Z values. NB: Surface
trends (etc) use this gridding technique.
- Triangulation: The Triangulation interpolator is an exact interpolator. The method works by creating triangles by drawing lines between data points. the original data points are connected in such a way that no triangle edges are intersected by other triangles. The result is a patchwork of triangular faces over the extent of the grid. Triangulation works best when your data points are evenly distributed over the grid area. Data sets that contain sparse areas result in distinct triangular facets on a surface plot or contour map. Triangulation is very effect at preserving break lines.
Gridding Parameters
Display New Grids on Basemap: Display the grid on the Basemap when the operation is complete.
Smooth Grid: Uses a smoothing algorithm to eliminate spikes in the resulting grid.
Use Gridding Distance: The farthest distance the output grid will extend from any seed data point.
Use Subsea: The measured depths for the tops will be converted to subsea or depth horizons will be converted to subsea before the gridding process is run.
Metric: The depths for the tops will be converted to metric or depth horizons will be converted to metric (if required) before the gridding process is run.
Data Value To Use: If there are multiple data values (i.e., if you are using mixed gridding). Note: In the case of multiple occurrences of the same top name, All Values is used.
Shallowest Value: If multiple values occur for a given point, only use the shallowest value.
Deepest Value: If multiple values occur for a given point, only use the deepest value.
All Values: If multiple values occur for a given point, use
all of the values in
the gridding process.
Grid and Contour Wizard Options
— MORE INFORMATION

|
Copyright © 2020 | SeisWare International Inc. | All rights reserved |