Well Properties: Curves
This page allows you configure curves and post them on the map. If you
wish to post the top/formation lines, see the Curve Top Ticks page. The top section
has generic settings applied to the curve display, and listed below are
the current curves and the Add, Edit or Delete
features.
-
Click the Add New Entry icon (
 ).
). -
Fill in the fields in the Add New Well Curve Display dialog.
-
Click
 .
.
-
Highlight the curve in the table.
-
Click the Edit Properties icon (
 )
.
)
. -
Change the parameters.
-
Click
.
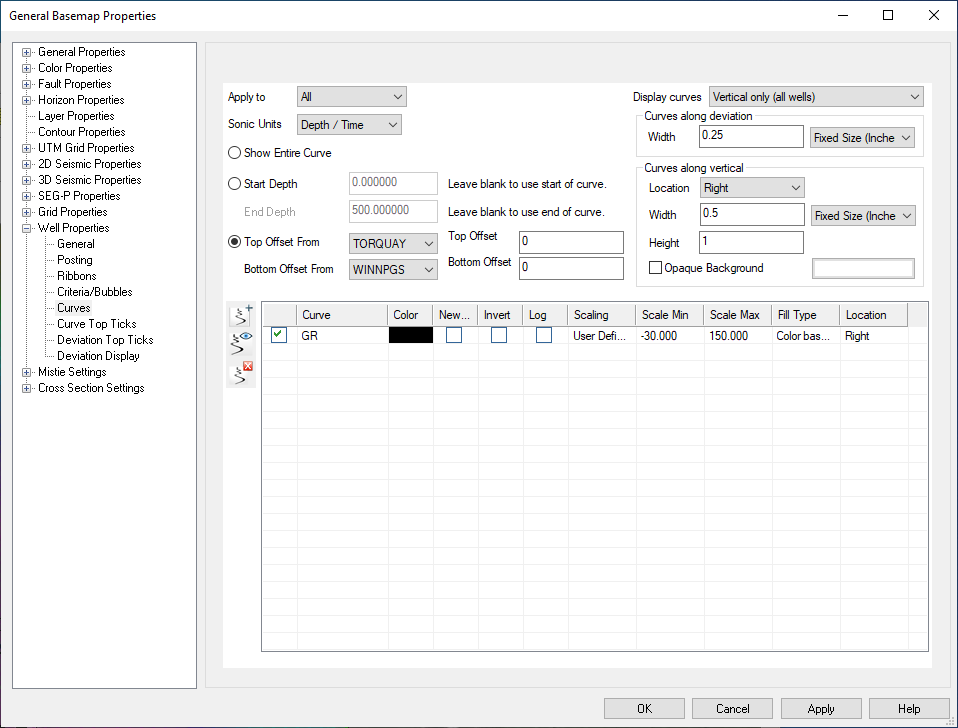
Display Parameters
Apply To: Select the wells that you want displaying curves.
-
All: Draws the curves beside all wells.
-
None: Does not draw the curves.
-
Criteria: Draws the curves beside each well that currently meets any criteria that is enabled.
-
Not Criteria: Draw the curves beside each well that currently does not meet any criteria that is enabled.
Windowing Methods
Show Entire Curve:
Select this option if you would like to see the entire curve at all
times.
Start Depth, End Depth:Specify the starting and ending depth for drawing the curves.
Top Offset From, Top
Offset, Bottom Offset From, and Bottom Offset: Top Offset From
specifies the top from to use as the starting reference. The Top Offset
allows you to move off from the top by some user specified amount. The
Bottom Offset From and Bottom Offset define the ending part of the
curve to draw.
Curve Display Parameters
Display Curves: Specify if curves should be displayed for vertical wells, deviated wells, or both.
Curves Along Deviation
Display parameters for a curve along a deviated well path.
Width:Define the width of the track. Fixed sized objects will remain the same regardless of the map scale. Variable sized objects will change size with the map scale.
Curves Along Vertical
Location: Specify where to draw the well curve relative to the well spot. Choose from top left, top, top right, right, bottom right, bottom, bottom left, and left.
Width, Height: Define the size for each curve track. Fixed sized objects will remain the same regardless of the map scale. Variable sized objects will change size with the map scale.
Opaque Background: If enabled, define the color to use as the background for each track. Curves are more legible if they have an opaque background, but it will block data drawn below.
Curves Display Table Icons
![]() Add new entry: Use
to add a new curve entry, and configure it using the Add New Well Curve Display dialog.
Add new entry: Use
to add a new curve entry, and configure it using the Add New Well Curve Display dialog.
![]() Edit Properties: Launches the Edit
Existing Well Curve Display dialog for the currently highlighted
entry on the curve to display table.
Edit Properties: Launches the Edit
Existing Well Curve Display dialog for the currently highlighted
entry on the curve to display table.
![]() Delete Selected Entry: Deletes the currently highlighted
entry from the table.
Delete Selected Entry: Deletes the currently highlighted
entry from the table.
Curves To Display (table): This area lists
all the curves that will be displayed. It shows the
name of the curve, the color, whether a new panel is used or not,
scaling information, if the curve is inverted, logarithmic scaling, curve fill type, and curve location.
You can use the check boxes at the far left to toggle the curve
postings on and off as needed instead of deleting and recreating the
entries.
Add/Edit Well Curve Display:
This dialog box will appear when you are adding a new curve for display, or if editing a currently displayed curve.
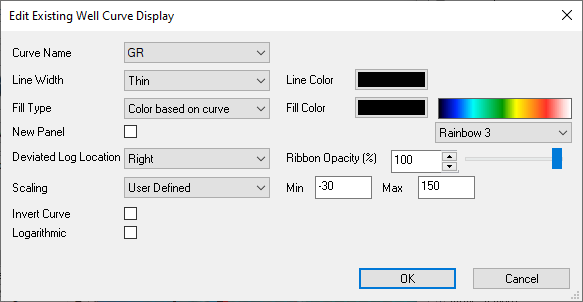
Curve Name: Use the drop down to select the curve that will be displayed. All loaded curve names will be available for selection.
Line Width: Specify the thickness of the curve line.
Line Color: Specify the color to be used for drawing the curve.
Fill Type: Specify how the curve will be filled. Options are None, Use Single Color, or Color Based on Curve.
Fill Color: Specify the fill color if using Use Single Color for the Fill Type. Use the ribbon drop down to specify a color palette if using Color Based on Curve for the Fill Type.
New Panel: If enabled, this curve will be drawn into a new track beside the previous one. Thus, if you want two resistivity curves in the same track, and a sonic in a track beside the resistivity curves, you need to ensure "New Panel" is checked on for the sonic curve. Also ensure that the first resistivity curve is also checked on and the second curve has it checked off. Ensure that you add the resistivity curves first.
Deviated Log Location: Specify the location of the curve when along a deviated well.
Ribbon Opacity: Set the ribbon opacity for the curve. Note: This is only available if Enable Transparency is turned on in Common Settings.
Scaling: Select the scaling method.
- User Defined: Specify the value to use as the minimum and maximum scaling values. Values outside the range specified will be clipped.
- Automatic: Use the minimum and maximum values in the curve for scaling the curve when drawing it.
Invert Curve: If checked on, the curve will be flipped on the horizontal axis. Useful for displaying sonic curves.
Logarithmic: If checked on, logarithmic scaling will be used. Useful for displaying exponential curves.
Also See:
— MORE INFORMATION

|
Copyright © 2020 | SeisWare International Inc. | All rights reserved |