Map View Tools: Interval Display Controls
The Interval Display Controls dialog box is used to select intervals for display, and control how they appear in the Map View window. To open the Interval Display Controls dialog box, on the Buttons toolbarclick  , or from the View menu select Intervals. The tabs in this dialog box are dependent on the Interval Classes that have been imported to the project, the menus let you access additional tools to import, save, and edit intervals, and the additional options at the top of the dialog box let you control the appearance of the intervals in the display.
Menus
The menus let you access additional interval tools.
File Menu: The File menu has options to save, load, and import intervals. ![]() See File menu options...
See File menu options...
Edit Menu: The Edit menu is used to access the interval data, add and edit existing data types, and create interval filters. ![]() See Edit menu options...
See Edit menu options...
Additional Options
The options at the top of the dialog box let you control for which wells intervals are displayed, and how they appear.
Display selected intervals for selected wells only: Display intervals for the selected wills only.
Display transparent intervals: Apply transparency to the intervals so the markers don't obscure underlying data.
Draw Outlines: Turn this on to draw an outline around the interval.
Outline Color: Click on the color field to open the Color Table to select or change the default color for the interval outline.
Interval Radius: Enter a value in map units to determine the size of the interval display.
End Scale:When using the Rounded Polygon Style, this determines how rounded the polygon is.
Tabs
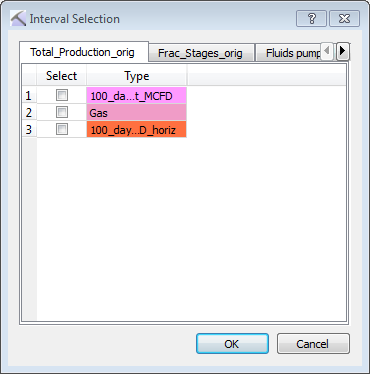
The number of tabs in this dialog box is controlled by the number of Interval Classes in the project. Every tab represents an Interval Class, each containing one or more Interval Types.
 Deselect All: Remove the check mark from the Select column for all Interval Types on all tabs.
Select: Place a check mark next to each Interval Type you want to display.
Type: The Interval Type associated with the Interval Class named on the tab, displayed with the fill color. You can change the fill color from the Interval Class and Type Management dialog box.
Min: Enter the minimum interval value you want displayed. Note that changing this value affects the displays in both the 3D View and Cross Section View windows.
Max: Enter the maximum interval value you want displayed in the vertical interval strip. Note that changing this value affects the displays in both the 3D View and Cross Section View windows.
Size by Value: Change the diameter of the interval cylinders based on their values.
Color by Value: Change the color of the interval cylinders based on their values. A rainbow color spectrum is applied, with low values represented by blue and high values represented by red.
Style: Select the shape of the interval. Choose from Bubble, Rounded Polygon, or Rectangular Polygon.
Fill: Select a fill style. Choose Solid or Outline.
If you are currently displaying intervals and want to view or edit the interval data, follow these steps.
- Click the Select Object icon
 .
. - Click on the interval. The Interval Data dialog box will open, displaying well and interval information. From here you can change the interval depths, as well as the interval class and type.
— MORE INFORMATION

|
Copyright © 2020 | SeisWare International Inc. | All rights reserved |