Well View Tools: Substitute Curves
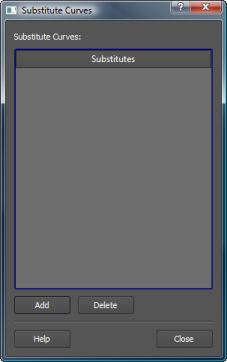
The Substitute Curves dialog box displays a list of existing substitute curves, and allows you to define a new substitute curve. Each substitute curve represents a prioritized list of curves of the same type that are named differently. Substitute curves are saved as “.sub” files in the substitutes folder within the templates folder in the project directory. You can open the Substitute Curves dialog box from the Edit menu in the Well View window.
 Add: Open the Define Substitutes dialog box to create a new substitute curve definition.
 Delete: Delete the selected substitute curve definition. If the Define Substitutes dialog opens when you select the curve definition, close the dialog and then delete the substitute curve.
-
Click on the name of the substitute curve. This will open the Define Substitutes dialog box.
-
Make any required changes.
-
Click
 .
.
Define Substitutes
Add a new substitute curve definition, or edit an existing curve definition from the Define Substitutes dialog box. The curves are given priority based on their order in the list.
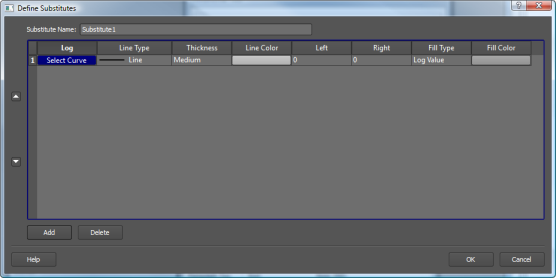
Substitute Name: Enter a name for the substitute curve definition. By default these are named sequentially starting with "Substitute1"
Add: Insert a blank row at the bottom of the table to add a curve to the list of substitute curve.
Delete: Remove the selected row from the table. To select a row, click the row number in the left column.
Track Order: When multiple curves are listed, the track order determines the priority in which the curves are used. Curves that are higher in the list will be used before other curves. To change the position of curve, click on the number in the left column and then use the arrow buttons ( /
/ ) to move the curve up or down in the list.
Define Substitutes Column Headings
Curve Log: Click to open the Select Log Curve dialog box, and select the data you want displayed in the track.
Line Type: Select a line style. Options include Line, Stipple 1, Stipple 2, Plus, Star, Circle, Diamond, and Dot.
Thickness: Select a line thickness. Options include Thin, Medium, and Thick
Line Color: Select a line color. Click in the cell and select a color from the Color Table.
Left/Right: Enter the left and right data values to determine the range of data to display, and the orientation of the curves.
Fill Type: Select a fill type, either Log Value or Solid.
Fill Color: When you select a Solid fill, click in the cell and select a fill color from the Color Table.
— MORE INFORMATION

|
Copyright © 2020 | SeisWare International Inc. | All rights reserved |