Zoom Window: Toolbars
The Zoom window has three toolbars that can be turned on or off using
the View Menu
of the Zoom Window.
Zoom Window Toolbars
Seismic Toolbar
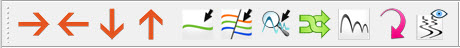
The Seismic Toolbar provides the most common functionality needed within the zoom window.
![]() Scroll
Right: Scroll the zoom
window one panel to the right. This can also be done
with
the right arrow key on your keyboard.
Scroll
Right: Scroll the zoom
window one panel to the right. This can also be done
with
the right arrow key on your keyboard.
![]() Scroll
Left: Scroll
the zoom
window one panel to the left. This can also be done
with
the left arrow key on your keyboard.
Scroll
Left: Scroll
the zoom
window one panel to the left. This can also be done
with
the left arrow key on your keyboard.
![]() Scroll
Down: Scroll
the zoom
window one panel downward. This can also be done with
the
down arrow key on your keyboard.
Scroll
Down: Scroll
the zoom
window one panel downward. This can also be done with
the
down arrow key on your keyboard.
![]() Scroll
Up: Scroll the zoom window
one panel upward. This can also be done with the
up arrow key on your keyboard.
Scroll
Up: Scroll the zoom window
one panel upward. This can also be done with the
up arrow key on your keyboard.
![]() Pick
Horizons:
Launches the horizon picking dialog
and puts the Seismic Viewer in
a state that allows horizon picking.
Pick
Horizons:
Launches the horizon picking dialog
and puts the Seismic Viewer in
a state that allows horizon picking.
![]() Pick
Faults:Launches the fault
picking dialog and puts the Seismic Viewer
in a
state that allows fault picking.
Pick
Faults:Launches the fault
picking dialog and puts the Seismic Viewer
in a
state that allows fault picking.
![]() Attribute Analysis: Redefine the
zoom for the
zoom window.
Attribute Analysis: Redefine the
zoom for the
zoom window.
![]() Mistie
Analysis:Launches a
dialog allowing the user to perform mistie
analysis on the
data
being displayed in the zoom window.
Mistie
Analysis:Launches a
dialog allowing the user to perform mistie
analysis on the
data
being displayed in the zoom window.
![]() Spectral
Analysis:Launches
the spectral analysis dialog
displaying the amplitude spectra of the window of data
displayed in the zoom window.
Spectral
Analysis:Launches
the spectral analysis dialog
displaying the amplitude spectra of the window of data
displayed in the zoom window.
![]() Redraw: Redraw the
data in the
zoom window.
Redraw: Redraw the
data in the
zoom window.
![]() Seismic
Display
Properties:Bring up the seismic display
properties dialog
for the zoom
window.
Seismic
Display
Properties:Bring up the seismic display
properties dialog
for the zoom
window.
Scaling Toolbar
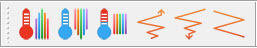
The Scaling Toolbar
is used to
quickly scale elements of the seismic display.
![]() Increase
VD Amplitude: Increase the amplitude of the variable density
component of the seismic
display. The property that controls the amount of increase is
the
VD
Step property on
the Trace
Scale
page of the viewer
properties.
Increase
VD Amplitude: Increase the amplitude of the variable density
component of the seismic
display. The property that controls the amount of increase is
the
VD
Step property on
the Trace
Scale
page of the viewer
properties.
![]() Decrease VD Amplitude:Decrease the amplitude of the variable density component of the
seismic
display. The property that controls the amount of decrease is
the
VD Step property on
the Trace Scale
page of the viewer
properties.
Decrease VD Amplitude:Decrease the amplitude of the variable density component of the
seismic
display. The property that controls the amount of decrease is
the
VD Step property on
the Trace Scale
page of the viewer
properties.
![]() Reset VD Amplitude:Reset the
amplitude of the variable density component of the seismic
display. .
Reset VD Amplitude:Reset the
amplitude of the variable density component of the seismic
display. .
![]() Increase
Wiggle Excursion:Increase the excursion of the wiggle
component of the seismic
display. The property that controls the amount of increase is
the
Excursion Step
property
on the Trace Scale
page of the
viewer properties.
Increase
Wiggle Excursion:Increase the excursion of the wiggle
component of the seismic
display. The property that controls the amount of increase is
the
Excursion Step
property
on the Trace Scale
page of the
viewer properties.
![]() Decrease Wiggle Excursion: Decrease
the excursion of the wiggle component of the seismic
display. The property that controls the amount of decrease is
the
Excursion Step
property
on the Trace Scale
page of the
viewer properties.
Decrease Wiggle Excursion: Decrease
the excursion of the wiggle component of the seismic
display. The property that controls the amount of decrease is
the
Excursion Step
property
on the Trace Scale
page of the
viewer properties.
![]() Reset Wiggle Excursion: Reset the
excursion of the wiggle component of the seismic
display. The value is returned to the Trace Excursion value
found on the Trace Scale
page of the
viewer properties.
Reset Wiggle Excursion: Reset the
excursion of the wiggle component of the seismic
display. The value is returned to the Trace Excursion value
found on the Trace Scale
page of the
viewer properties.
Status Bar

The Status Bar is used to give feedback to the user as they move their
cursor across the seismic display. The Status Bar will track
the
closest horizon or fault on the left. In addition it will
track
the
closest trace and line for 3D displays, or the closest shot and CDP for
2D displays. The time and amplitude values under the cursor
are
also
tracked. Depth values for synthetic tracks and curve overlays
will
track in the final box. Depth values are subsea.
Also See
— MORE INFORMATION

|
Copyright © 2020 | SeisWare International Inc. | All rights reserved |