Zoom Window: Spectral Analysis
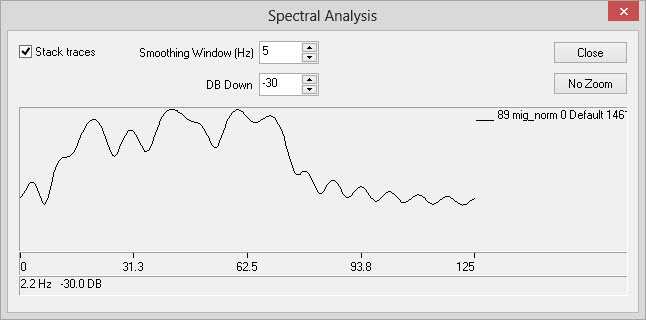
The Spectral Analysis dialog is used to display the frequency content
of
the data being displayed in the Zoom
window. You can access this feature by clicking the Spectral Analysis icon (![]() ) on the Zoom Window Toolbar. When
the window opens you will see a graph displaying amplitude versus
frequency of any seismic lines contained in the zoom window. If there
is more than one dataset in your zoom window the left most dataset will
be
drawn
first in black. The right most dataset will be drawn over top
of
the left dataset in white.
) on the Zoom Window Toolbar. When
the window opens you will see a graph displaying amplitude versus
frequency of any seismic lines contained in the zoom window. If there
is more than one dataset in your zoom window the left most dataset will
be
drawn
first in black. The right most dataset will be drawn over top
of
the left dataset in white.
-
Left click on the display.
-
Drag the mouse and release to complete the zoom. The display will zoom to the frequency area selected.
-
To undo the zoom click
 .
.
General Information

Stacking Parameters
Stack Traces: Stacks all displayed traces into a single trace. After stacking and spectral analysis a smoothing operator is applied to the result based on the Smoothing Window (Hz) operator.
Smoothing Window: The length of the smoothing
operator applied to stacked traces.
Display Parameters
DB Down: The DB down controls the vertical scale of the graph in decibels with zero decibels being at the top of the graph.
No Zoom: Undo any zooming.
Also See
— MORE INFORMATION

|
Copyright © 2020 | SeisWare International Inc. | All rights reserved |