Seismic Viewer: Mistie Analysis
The Mistie Analysis dialog is used to perform interactive mistie
analysis
between two or more seismic lines, or between a seismic line and a
synthetic. The mistie results are generated by analyzing only the data
encompassed in the Zoom window.
 How do I perform a mistie analysis?
- Launch the Mistie Analysis
dialog in one of the following ways:
- The Zoom
Window: Click in the Mistie icon
 or
select Mistie Analysis from
the Edit
menu.
or
select Mistie Analysis from
the Edit
menu. - The
Seismic Viewer: Click on the Mistie icon , and then click, hold and drag to define a
zoom window.
- The Zoom
Window: Click in the Mistie icon
-
The Mistie dialog that appears will have initial Estimates for Phase/Shift/Gain changes that need to be applied.
-
At the top of the dialog ensure you have the correct line in the Active and Reference fields. All changes will be applied to the Active line.
- Tie the data:
- To let
SeisWare tie the data: Click
 to apply
all of these change. Each time the Estimate is applied, the data in the
zoom window used for analysis changes, so there may be new estimates.
Doing multiple iterations improves the results.
to apply
all of these change. Each time the Estimate is applied, the data in the
zoom window used for analysis changes, so there may be new estimates.
Doing multiple iterations improves the results. - To tie
the data manually: Use the Phase/Gain
Sliders to apply
user defined changes.
- To let
SeisWare tie the data: Click
-
(Optional) To help get an optimal tie, you can apply a frequency filter.
-
Once satisfied with the tie you can
 , which will
store the changes in memory only, or
, which will
store the changes in memory only, or  which will create a new permanently
altered version of the line.
which will create a new permanently
altered version of the line.
General Information
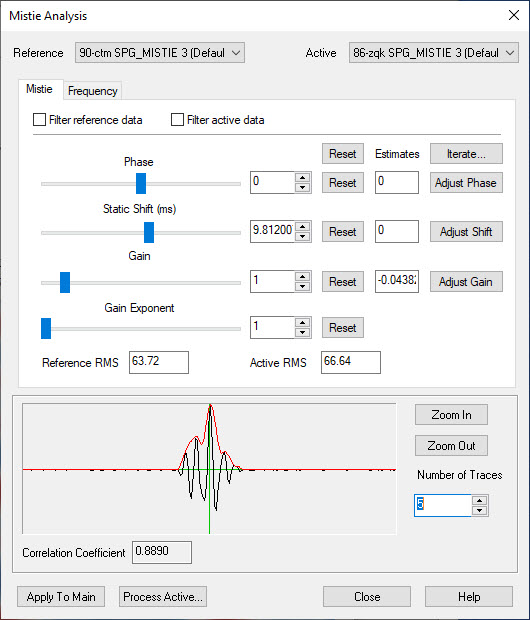
Mistie Datasets
Reference: This specifies the dataset that will serve as the reference for balancing your seismic data.
Active:
This specifies the dataset that will have the new phase, static
shift,
and
gain
applied to it.
Mistie Tab
Filter reference data: When checked, this applies the filter found on the Frequency tab to the reference dataset.
Filter active data: When checked, this applies the filter found on the Frequency tab to the active dataset.
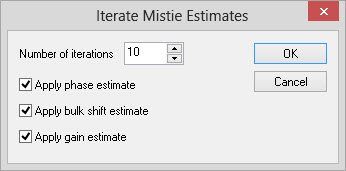
Iterate... Opens a dialog that allows the
user to apply the mistie estimates
iteratively
to more quickly arrive at a machine generated best guess. The
user
has the option to apply any combination of phase, static shift and gain
estimates.
Phase: The phase slider and text area allow the user to specify a phase to apply to the active line to balance the data.
 Adjust Phase: This button will apply
the phase in the Estimates
box to the
dataset.
The estimate is a value calculated to produce an optimal cross
correlation.
Adjust Phase: This button will apply
the phase in the Estimates
box to the
dataset.
The estimate is a value calculated to produce an optimal cross
correlation.
Static Shift: The static shift slider and text area allow the user to specify a new static shift to apply to the active line being displayed.
 Adjust Shift: This button will apply
the
static shift in the Estimates
box to
the dataset. The estimate is a value calculated to produce an
optimal
cross correlation.
Adjust Shift: This button will apply
the
static shift in the Estimates
box to
the dataset. The estimate is a value calculated to produce an
optimal
cross correlation.
Gain: The gain slider and text area allow the user to specify a gain to apply to the active line to attempt to match the amplitude of the reference line.
 Adjust
Gain: This button will apply the gain
in the Estimates
box to the
dataset.
The estimate is a value calculated to give the active line the same RMS
as the reference line.
Adjust
Gain: This button will apply the gain
in the Estimates
box to the
dataset.
The estimate is a value calculated to give the active line the same RMS
as the reference line.
Gain Exponent: The gain exponent slider and text area allow the user to specify a gain exponent to apply to the active line. A gain exponent greater than 1 will apply a higher gain as you go down the trace.
Reference RMS: This is the resulting RMS of the reference dataset.
Active RMS: This is the resulting RMS of the
active dataset.
Cross Correlation Window
The cross correlation window provides a cross correlation graph to aid
the user in balancing their data. The black line represents
the
cross
correlation. The red line represents the amplitude envelope
of
the
cross correlation. A balanced dataset will have the cross
correlation
centered over the green axes in the window. The cross
correlation is
calculated over the window of data being displayed in the zoom
window. Ideally,
the cross-correlation should appear as a zero-phase wavelet centered on
the cross-hairs. The peak of the amplitude envelope should appear at
the peak of this zero phase wavelet.
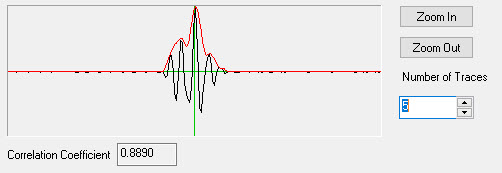
Correlation Coefficient: The correlation coefficient value represents the degree of cross correlation. This value will vary between -1.0 and 1.0. A negative correlation coefficient value indicates the two lines are out of phase.
 Zoom In: This button zooms in the cross
correlation graph over the center of the
graph. The zoom is only performed in the horizontal
direction.
Zoom In: This button zooms in the cross
correlation graph over the center of the
graph. The zoom is only performed in the horizontal
direction.
 Zoom Out: This button zooms out the cross
correlation graph after a
has been performed.
Zoom Out: This button zooms out the cross
correlation graph after a
has been performed.
Number of Traces: This specifies the number of traces on either side of the intersection of the two datasets to use for the cross correlation.
Processing Data
Apply
To Main: This
applies the current mistie parameters to the main window and exits
out
of mistie analysis. It store the changes in memory only and looses the
change when you close the Seismic Viewer. To apply these changes after
applying to main but before exiting the Seismic Viewer, select Quick Processing from the Edit menu.
Process
Active...: Clicking
this button will launch a batch processing
dialog to perform
processing
on the entire Active Line. The batch job
will contain the
parameters from the mistie analysis dialog. After processing
the
line, the new version will be defined as the working set and any
subsequent
seismic displays will display the processed line rather than the
current
version.
 Save: Saves the current intersection
to the
database, so that it can be used
with an Automatic
Mistie Analysis run. This intersection can also be used for the
displaying mistie
dots on the Basemap. Note: The values
resulting from the mistie are not saved.
Save: Saves the current intersection
to the
database, so that it can be used
with an Automatic
Mistie Analysis run. This intersection can also be used for the
displaying mistie
dots on the Basemap. Note: The values
resulting from the mistie are not saved.
 Close: Close the dialog and
undo any
mistie parameters applied to the data.
Close: Close the dialog and
undo any
mistie parameters applied to the data.
Frequency Tab
This tab allows you to interactively adjust the frequency of the data
to get a more accurate mistie.
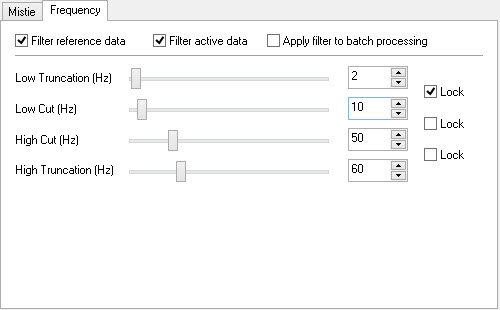
Filtering Preferences
Filter reference data: When checked, this applies the filter to the reference dataset.
Filter active data: When checked, this applies the filter to the active dataset.
Apply filter to batch processing: When checked, this will apply the filter to the data when you choose to batch process it using the Process Active button. Often you will want to leave this button unchecked so only the phase, shift and gain are applied when processing the data into a new disk file.
Filtering Parameters
Low Truncation: All frequencies below this value are removed. Frequencies between this and the Low Cut frequency are smoothly ramped up using a cosine taper.
Low Cut: Frequencies between the Low Truncation and this frequency are smoothly ramped up using a cosine taper. Frequencies between this and the High Cut frequency are left unchanged.
High Cut: Frequencies between the Low Cut and this frequency are left unchanged. Frequencies between this and the High Truncation frequency are smoothly ramped down using a cosine taper.
High Truncation: Frequencies above this value are removed. Frequencies between the High Cut and this frequency are smoothly ramped down using a cosine taper.
Lock: When checked the first toggle will maintain the difference between the Low Truncation and Low Cut frequencies. When checked the second toggle will maintain the difference between the Low Cut and High Cut frequencies. When checked the third toggle will maintain the difference between the High Cut and High Truncation frequencies.
Note: If you find that the slider bars seem sluggish, it is recommended that you physically narrow the size of the pop up zoom window. This will reduce the amount of drawing performed, improving the interactivity of the adjustments.
Also See
— MORE INFORMATION

|
Copyright © 2020 | SeisWare International Inc. | All rights reserved |