Time/Depth Velocity Modeling: Log Preview
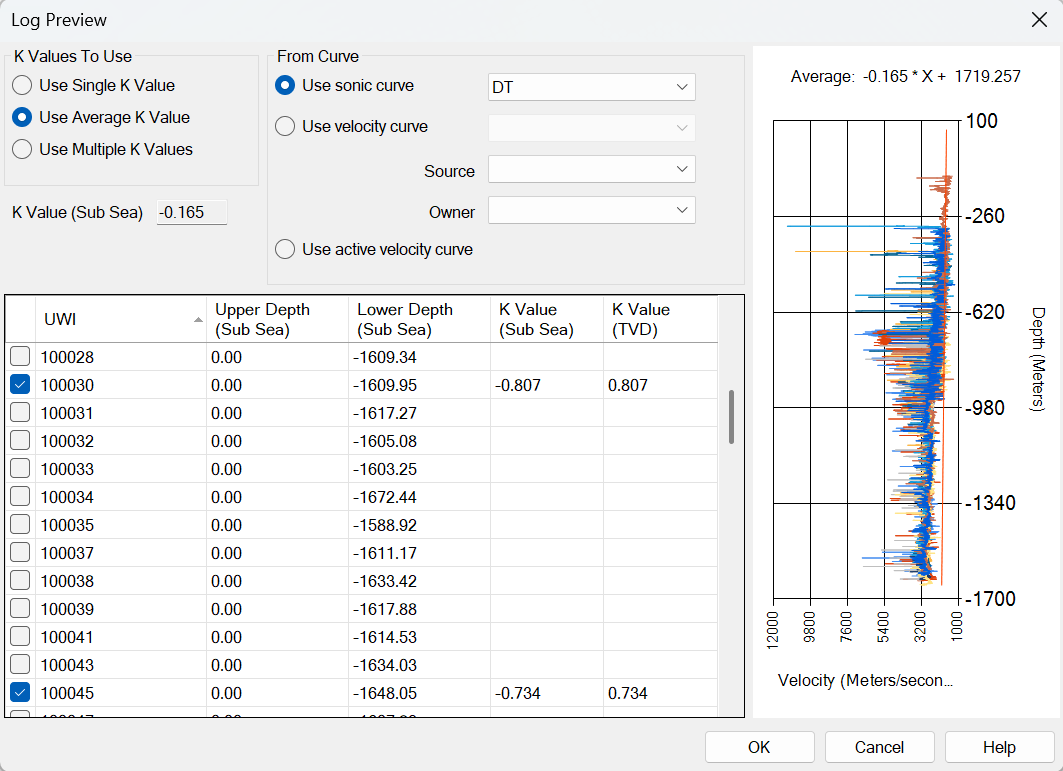
The Log Preview dialog box is used when you are incorporating a compaction factor (K value) into your time/depth calculation. The K value, calculated using the slope of the sonic or velocity curve over a specific depth range, takes into account increased velocities with depth, allowing you to calculate a more accurate depth surface. You can use a single K value, calculate an average K value, or create a grid using multiple K values.
Open the Log Preview dialog
box by turning on Use
Compaction or clicking  on the Advanced Options tab
in the Layer Details dialog
box.
on the Advanced Options tab
in the Layer Details dialog
box.
K Value To Use
Select the method for determining the compaction factor (K value).
Use Single K Value: A single K value will be used in the time/depth calculation. Enter the compaction factor into the K Value field.
K Value: Enter the K value to use in the calculation.
Use Average K Value: An average K value will be calculated using the wells selected in the well table. This value will be displayed in the K Value field.
K Value: Displays the average K value calculated using the wells selected in the well table. This value can't be edited.
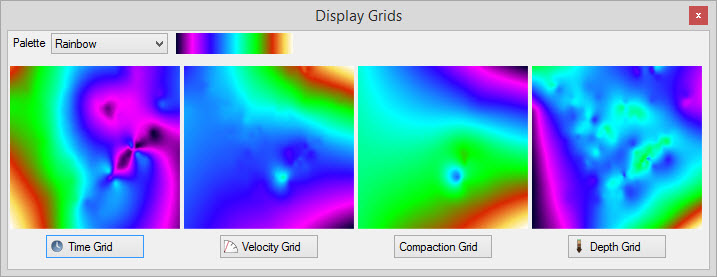
Use Multiple K Values: A compaction grid will be created using the K values of the wells selected in the well table. This grid will be displayed in the Display Grids dialog box.
From Curve
Select the curves to use when calculating the K
values. This field is only active when Use Average K Value
or Use Multiple K
Values is selected.
Use Sonic Curve: Select the name of the sonic curve you want to use to determine the K value. The compaction factor will be calculated for each well for which the curve exists, and displayed in the K Value column of the well table. Use the Source and Owner fields to filter the curve selection.
Use Velocity Curve: Select the name of the velocity curve you want to use to determine the compaction factor K value. The compaction factor will be calculated for each well for which that curve exists, and displayed in the K Value column of the well table. Use the Source and Owner fields to filter the curve selection.
Use Active Velocity Curve: Use the active velocity curve to determine the K value. The compaction factor will be calculated for each well that has a velocity curve, and displayed in the K Value column of the well table.
Source: Select from a list of available sources. This determines which sonic or velocity curve is used.
Owner: Select from a list of available owners. This determines which sonic or velocity curve is used.
Well Table
The well table lists all of the wells being used in the time/depth
calculation. Select the wells to include when determining the final K Value by placing
a check mark next to the UWI.
This table is only active when Use
Average K Value or Use
Multiple K
Values is selected.
UWI: A list of wells being used in the time/depth calculation for the current layer.
Upper Depth (subsea): The subsea depth that represents the upper limit for the curve data being used to calculate the K value. For the first layer, this will be the datum elevation for the well. For subsequent layers, it will be the depth of the shallower layer.
Lower Depth (subsea): The subsea depth that represents the lower limit for the curve data being used to calculate the K value. This is the depth of the current layer.
K Value (Sub Sea and TVD): The compaction value for the well, determined from the slope of the sonic or velocity curve for the well between the Upper Depth and Lower Depth.
Graph
This graph plots depth and velocity points for the selected curves. If
behaves differently depending on your selection in the K Value to Use section
of the dialog box.
Use Average K Value
The graph displays the calculated slope, used to determine the
compaction factor (K value), for every well selected in the well table,
as well as the average slope, displayed in red.
Click on an individual well in the well table to highlight the slope
for that well. The equation for the average K value is displayed at the
top of the graph.
Use Multiple K Values
Select a well in the well table to see the graph for an individual
well, and the calculated slope. The equation for
the K value is displayed at the top of the graph.
Also See
— MORE INFORMATION

|
Copyright © 2020 | SeisWare International Inc. | All rights reserved |