3D Visualizer: Object Properties
The Object Properties dialog box is used to specify the properties for the currently selected object.
Select an object by doing one of the following:
-
Enter selection mode by pressing S on your keyboard, and then click on an object in the scene window.
-
Select an object from the Object list at the top of the Object Properties dialog box.
-
Select an object in the Scene Tree dialog box.
Scene Properties
Scene: Specify the general properties for the display window. ![]() See scene properties...
See scene properties...
 Scene Properties
Domain: The vertical domain of the scene, time or depth. This is for information only. To change the domain, create a new scene from the Scenes dialog box.
Depth Annotation: Select the reference for the depth annotation, Subsea or TVD.
Seismic Depth Datum: The depth datum of the seismic data in the project. This is for information only.
Seismic Time Datum: The time datum of the seismic data in the project. This is for information only.
Background Color: Click on the color field to open the Select Color dialog box and change the background color for the scene.
Highlight Color: The highlight color is used to indicate which object is selected. Click on the color field to open the Select Color dialog box and change the highlight color for the scene.
Enable Tracking: Enable tracking between the 3D Geophysics application and other open applications.
Tracking Color: Click on the color field to open the Select Color dialog box and select a color do the tracking cursor.
X Scale: Use the up and down arrows or enter a value to change the X scale relative to the Y scale. Turn on Lock to ensure the X and Y values stay the same.
Y Scale: Use the up and down arrows or enter a value to change the Y scale relative to the X scale. Turn on Lock to ensure the X and Y values stay the same.
Z Scale: Use the up and down arrows or enter a value to change the Z scale. This corresponds to the value displayed on the Vertical Exaggeration Toolbar, and can be changed from either location.
Area of Interest: Manually enter Minimum and Maximum X, and Y values to define the area of interest, or select an area of interest from the Basemap. Defining an area of interest will limit the data items available for selection in the Data Selection dialog box, but will not clip any objects. When these are left blank, all of the data will be available. Note: This will not remove any items that are already in the scene.
Select from Map: Click and then select an area of interest from the Basemap.

Clear AOI: Remove the Minimum and Maximum X, and Y values. When these are left blank, tall of the data will be available for display.
Use Dir Light: Use a light shining from a specific direction specified by the Azimuth and Dip settings. Adjust the Ambient and Diffuse light for a more realistic rendering of the surface.
Dir Light Ambient:Use the slider to adjust the ambient camera light. Ambient light is cast equally over the objects in the scene. Increasing this value will cause the scene to appear brighter, but will not accentuate the 3D nature of the scene.
Dir Light Diffuse: Use the slider to adjust the diffuse camera light. Diffuse light is directional. Increasing this value will help to accentuate the 3D nature of the scene.
Dir Light Azimuth: Use the slider to select the origination angle for the light, or enter an angle in degrees. A value of 0 or 360 indicates that the light is shining directly north. A value of 180 indicates that the light is shining directly south.
Dir Light Dip: Use the slider to select the dip angle for the light, or enter an angle. A value of 90 indicates that the light is shining down from above the scene. A value of -90 indicates that the light is shining up from directly below the scene.
Use Camera Light:Use the camera light, or a light originating at the front of the scene, to illuminate the scene. Adjust the Ambient and Diffuse light for a more realistic rendering of the surface.
Camera Light Ambient: Use the slider to adjust the ambient camera light. Ambient light is cast equally over the objects in the scene. Increasing this value will cause the scene to appear brighter, but will not accentuate the 3D nature of the scene.
Camera Light Diffuse: Use the slider to adjust the diffuse camera light. Diffuse light is directional. Increasing this value will help to accentuate the 3D nature of the scene.
3D Seismic Properties
Seismic File: Specify the general display properties for the seismic volume, including version and postings. ![]() See seismic file properties...
See seismic file properties...
 Seismic File Properties
Show Postings: Show the line and trace postings at the surface of the seismic volume.
Posting Font: Specify a font for the posted values.
Posting Color: Click on the color field to open the Select Color dialog box and change the color for the postings.
Posting Height: Enter a height for the postings in the appropriate units. When Fixed Size (Points) is selected, the postings will retain their size regardless of zoom level. When Variable Size (Meters) is selected, the postings will appear to get bigger as you zoom in, and smaller as you zoom out.
Use first Trace/Line/Z: When this is turned on, postings will be displayed at the first trace, line, and vertical slice in the file. When this is turned off, enter Posting Start Trace, Line, and Z values.
Use Last Trace/Line/Z: When this is turned on, postings will be displayed at the last trace, line, and vertical slice in the file. When this is turned off, enter Posting End Trace, Line, and Z values.
Increment Trace By: Enter a value to determine how often trace values are posted.
Increment Line By: Enter a value to determine how often line values are posted.
Increment Z By: Enter a value to determine how often vertical slice values are posted.
Limit Display Extents: Limit the extents of the display by setting a Start and End Trace, Start and End Lineand aStart and End Z value.
Seismic Dataset: Specify the properties for the selected seismic dataset. ![]() See dataset Properties...
See dataset Properties...
Dataset Properties
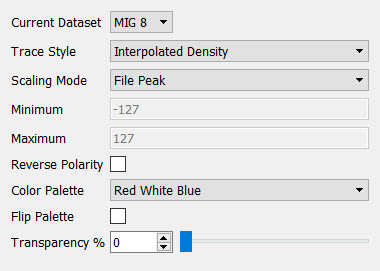 Current Dataset: Select from the list of available datasets to change the version of the seismic file being displayed.
Trace Style: Specify the display style for the seismic data. If you select Interpolated Density the seismic data will appear smooth. If you select Variable Density the seismic data will appear more blocky.
Scaling Mode: Select a scale mode to determine how the palette will be scaled.
- File Peak: Use the peak value of the data file as the scale reference value.
- File Average: Use the average data value from the data file as the scale reference value.
- File RMS: Use the RMS value from the data file as the scale reference value.
- User Defined: Enter Minimum and Maximum values to use as scale reference values. This is most appropriate when displaying attribute data whose values don't center around zero.
Minimum: The minimum value used to scale against when Range Type is set to Custom. This is most useful when viewing data that is not centered about zero. When another Range Type is selected, this field is informational.
Maximum: The maximum value used to scale against when Range Type is set to Custom. This is most useful when viewing data that is not centered about zero. When another Range Type is selected, this field is informational.
Reverse Polarity: Reverse the polarity of the seismic display.
Color Palette: Select a color palette from the list of available palettes. The palette selection will also be updated in the Palette Toolbar.
Flip Palette: Flip the colors in the palette.
Transparency (%): Adjust the transparency of the item. 0 indicates that the display is fully opaque, and 100 indicates that the display is fully transparent.
lnline: Specify the properties for the selected inline. ![]() See inline properties...
See inline properties...
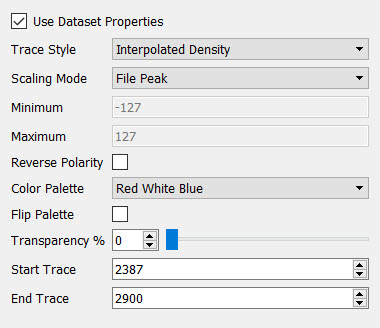 Inline Properties
Use Dataset Properties: When this is turned on, changing the properties of the current seismic object (inline, crossline, z-slice, arbline, horizon slice) will change the properties for all of the seismic objects that have this option turned on. When this is turned off, changing the properties of the current seismic object will not affect the properties of other seismic objects.
Trace Style: Specify the display style for the seismic data. If you select Interpolated Density the seismic data will appear smooth. If you select Variable Density the seismic data will appear more blocky.
Scaling Mode: Select a scale mode to determine how the palette will be scaled.
- File Peak: Use the peak value of the data file as the scale reference value.
- File Average: Use the average data value from the data file as the scale reference value.
- File RMS: Use the RMS value from the data file as the scale reference value.
- User Defined: Enter Minimum and Maximum values to use as scale reference values. This is most appropriate when displaying attribute data whose values don't center around zero.
Minimum: The minimum value used to scale against when Range Type is set to Custom. This is most useful when viewing data that is not centered about zero. When another Range Type is selected, this field is informational.
Maximum: The maximum value used to scale against when Range Type is set to Custom. This is most useful when viewing data that is not centered about zero. When another Range Type is selected, this field is informational.
Reverse Polarity: Reverse the polarity of the seismic display.
Color Palette: Select a color palette from the list of available palettes. The palette selection will also be updated in the Palette Toolbar.
Flip Palette: Flip the colors in the palette.
Transparency (%): Adjust the transparency of the item. 0 indicates that the display is fully opaque, and 100 indicates that the display is fully transparent.
Start Trace: Specify the first trace to display on the inline.
End Trace: Specify the last trace to display on the inline.
Crossline: Specify the properties for the selected crossline. ![]() See crossline properties...
See crossline properties...
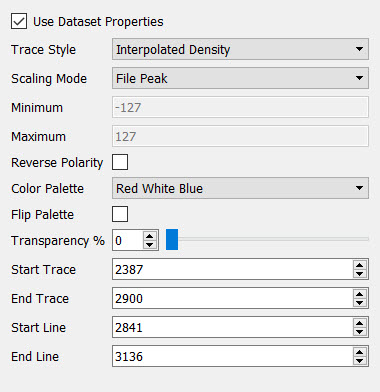
Crossline Properties
Use Dataset Properties: When this is turned on, changing the properties of the current seismic object (inline, crossline, z-slice, arbline, horizon slice) will change the properties for all of the seismic objects that have this option turned on. When this is turned off, changing the properties of the current seismic object will not affect the properties of other seismic objects.
Trace Style: Specify the display style for the seismic data. If you select Interpolated Density the seismic data will appear smooth. If you select Variable Density the seismic data will appear more blocky.
Scaling Mode: Select a scale mode to determine how the palette will be scaled.
- File Peak: Use the peak value of the data file as the scale reference value.
- File Average: Use the average data value from the data file as the scale reference value.
- File RMS: Use the RMS value from the data file as the scale reference value.
- User Defined: Enter Minimum and Maximum values to use as scale reference values. This is most appropriate when displaying attribute data whose values don't center around zero.
Minimum: The minimum value used to scale against when Range Type is set to Custom. This is most useful when viewing data that is not centered about zero. When another Range Type is selected, this field is informational.
Maximum: The maximum value used to scale against when Range Type is set to Custom. This is most useful when viewing data that is not centered about zero. When another Range Type is selected, this field is informational.
Reverse Polarity: Reverse the polarity of the seismic display.
Color Palette: Select a color palette from the list of available palettes. The palette selection will also be updated in the Palette Toolbar.
Flip Palette: Flip the colors in the palette.
Transparency (%): Adjust the transparency of the item. 0 indicates that the display is fully opaque, and 100 indicates that the display is fully transparent.
Start Line: Specify the first line to display on the crossline.
End Line: Specify the last line to display on the crossline.
Arbline: Specify the properties for the selected arbline. ![]() See arbline properties...
See arbline properties...
 Arbline Properties
Use Dataset Properties: When this is turned on, changing the properties of the current seismic object (inline, crossline, z-slice, arbline, horizon slice) will change the properties for all of the seismic objects that have this option turned on. When this is turned off, changing the properties of the current seismic object will not affect the properties of other seismic objects.
Trace Style: Specify the display style for the seismic data. If you select Interpolated Density the seismic data will appear smooth. If you select Variable Density the seismic data will appear more blocky.
Scaling Mode: Select a scale mode to determine how the palette will be scaled.
- File Peak: Use the peak value of the data file as the scale reference value.
- File Average: Use the average data value from the data file as the scale reference value.
- File RMS: Use the RMS value from the data file as the scale reference value.
- User Defined: Enter Minimum and Maximum values to use as scale reference values. This is most appropriate when displaying attribute data whose values don't center around zero.
Minimum: The minimum value used to scale against when Range Type is set to Custom. This is most useful when viewing data that is not centered about zero. When another Range Type is selected, this field is informational.
Maximum: The maximum value used to scale against when Range Type is set to Custom. This is most useful when viewing data that is not centered about zero. When another Range Type is selected, this field is informational.
Reverse Polarity: Reverse the polarity of the seismic display.
Color Palette: Select a color palette from the list of available palettes. The palette selection will also be updated in the Palette Toolbar.
Flip Palette: Flip the colors in the palette.
Transparency (%): Adjust the transparency of the item. 0 indicates that the display is fully opaque, and 100 indicates that the display is fully transparent.
Z-slice: Specify the properties for the selected Z-slice. ![]() See Z-slice properties...
See Z-slice properties...
 Z-slice Properties
Use Dataset Properties: When this is turned on, changing the properties of the current seismic object (inline, crossline, z-slice, arbline, horizon slice) will change the properties for all of the seismic objects that have this option turned on. When this is turned off, changing the properties of the current seismic object will not affect the properties of other seismic objects.
Trace Style: Specify the display style for the seismic data. If you select Interpolated Density the seismic data will appear smooth. If you select Variable Density the seismic data will appear more blocky.
Scaling Mode: Select a scale mode to determine how the palette will be scaled.
- File Peak: Use the peak value of the data file as the scale reference value.
- File Average: Use the average data value from the data file as the scale reference value.
- File RMS: Use the RMS value from the data file as the scale reference value.
- User Defined: Enter Minimum and Maximum values to use as scale reference values. This is most appropriate when displaying attribute data whose values don't center around zero.
Minimum: The minimum value used to scale against when Range Type is set to Custom. This is most useful when viewing data that is not centered about zero. When another Range Type is selected, this field is informational.
Maximum: The maximum value used to scale against when Range Type is set to Custom. This is most useful when viewing data that is not centered about zero. When another Range Type is selected, this field is informational.
Reverse Polarity: Reverse the polarity of the seismic display.
Color Palette: Select a color palette from the list of available palettes. The palette selection will also be updated in the Palette Toolbar.
Flip Palette: Flip the colors in the palette.
Transparency (%): Adjust the transparency of the item. 0 indicates that the display is fully opaque, and 100 indicates that the display is fully transparent.
Start Trace: Specify the first trace to display on the Z-slice.
End Trace: Specify the last trace to display on the Z-slice.
Start Line: Specify the first line to display on the Z-slice.
End Line: Specify the last line to display on the Z-slice.
Horizon Slice: Specify the properties for the selected horizon slice. ![]() See horizon slice properties...
See horizon slice properties...
Horizon Slice Properties
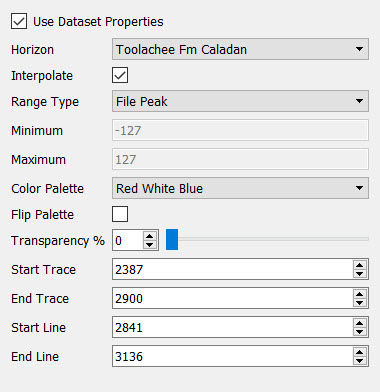 Use Dataset Properties: When this is turned on, changing the properties of the current seismic object (inline, crossline, z-slice, arbline, horizon slice) will change the properties for all of the seismic objects that have this option turned on. When this is turned off, changing the properties of the current seismic object will not affect the properties of other seismic objects.
Horizon: Select the horizon to use to create the slice. Note: Until you select a Horizon in the Object Properties dialog box, the slice will not appear on the display.
Interpolate: Interpolate the data values to give the object a smooth appearance.
Range Type: Select a range type to determine how the palette will be scaled.
- File Peak: Use the peak value of the data file as the scale reference value.
- File Average: Use the average data value from the data file as the scale reference value.
- File RMS: Use the RMS value from the data file as the scale reference value.
- User Defined: Enter Minimum and Maximum values to use as scale reference values. This is most appropriate when displaying attribute data whose values don't center around zero.
Minimum: The minimum value used to scale against when Range Type is set to Custom. This is most useful when viewing data that is not centered about zero. When another Range Type is selected, this field is informational.
Maximum: The maximum value used to scale against when Range Type is set to Custom. This is most useful when viewing data that is not centered about zero. When another Range Type is selected, this field is informational.
Color Palette: Select a color palette from the list of available palettes. The palette selection will also be updated in the Palette Toolbar.
Flip Palette: Flip the colors in the palette.
Transparency (%): Adjust the transparency of the item. 0 indicates that the display is fully opaque, and 100 indicates that the display is fully transparent.
Start Trace: Specify the first trace to display on the horizon slice.
End Trace: Specify the last trace to display on the horizon slice.
Start Line: Specify the first line to display on the horizon slice.
End Line: Specify the last line to display on the horizon slice.
2D Seismic Properties
2D Seismic Folder: Specify the display properties for all of the 2D seismic data within the folder. You can override these properties for a group of files or an individual line by turning on Override Folder Settings. ![]() See 2D seismic folder properties...
See 2D seismic folder properties...
 2D Seismic Folder Properties
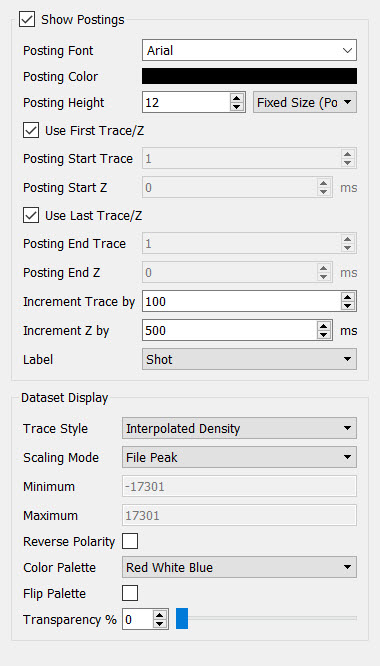
Show Postings: Show the line and trace postings at the surface of the seismic line.
Posting Font: Specify a font for the posted values.
Posting Color: Click on the color field to open the Select Color dialog box and change the color for the postings.
Posting Height: Enter a height for the postings in the appropriate units. When Fixed Size (Points) is selected, the postings will retain their size regardless of zoom level. When Variable Size (Meters) is selected, the postings will appear to get bigger as you zoom in, and smaller as you zoom out.
Use first Trace/Z: When this is turned on, postings will be displayed at the first trace, line, and vertical slice in the file. When this is turned off, enter Posting Start Trace and Z values.
Use Last Trace/Z: When this is turned on, postings will be displayed at the last trace, line, and vertical slice in the file. When this is turned off, enter Posting End Trace and Z values.
Increment Trace By: Enter a value to determine how often trace values are posted.
Increment Z By: Enter a value to determine how often vertical slice values are posted.
Label: Specify whether to display Shot or CDP information.
Trace Style: Specify the display style for the seismic data. If you select Interpolated Density the seismic data will appear smooth. If you select Variable Density the seismic data will appear more blocky.
Scaling Mode: Select a scale mode to determine how the palette will be scaled.
- File Peak: Use the peak value of the data file as the scale reference value.
- File Average: Use the average data value from the data file as the scale reference value.
- File RMS: Use the RMS value from the data file as the scale reference value.
- User Defined: Enter Minimum and Maximum values to use as scale reference values. This is most appropriate when displaying attribute data whose values don't center around zero.
Minimum: The minimum value used to scale against when Range Type is set to Custom. This is most useful when viewing data that is not centered about zero. When another Range Type is selected, this field is informational.
Maximum: The maximum value used to scale against when Range Type is set to Custom. This is most useful when viewing data that is not centered about zero. When another Range Type is selected, this field is informational.
Reverse Polarity: Reverse the polarity of the seismic display.
Color Palette: Select a color palette from the list of available palettes. The palette selection will also be updated in the Palette Toolbar.
Flip Palette: Flip the colors in the palette.
Transparency (%): Adjust the transparency of the item. 0 indicates that the display is fully opaque, and 100 indicates that the display is fully transparent.
2D Seismic File: Specify the general display properties for the seismic line, including dataset version and postings. ![]() See 2D seismic file properties...
See 2D seismic file properties...
 2D Seismic File Properties
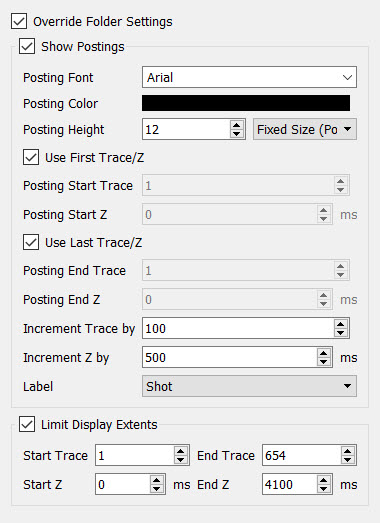
Override Folder Settings: Turn this on to create custom property settings for the current seismic line. When this is turned off the 2D Seismic File Properties are applied to the line.
Show Postings: Show the line and trace postings at the surface of the seismic line.
Posting Font: Specify a font for the posted values.
Posting Color: Click on the color field to open the Select Color dialog box and change the color for the postings.
Posting Height: Enter a height for the postings in the appropriate units. When Fixed Size (Points) is selected, the postings will retain their size regardless of zoom level. When Variable Size (Meters) is selected, the postings will appear to get bigger as you zoom in, and smaller as you zoom out.
Use first Trace/Z: When this is turned on, postings will be displayed at the first trace, line, and vertical slice in the file. When this is turned off, enter Posting Start Trace and Z values.
Use Last Trace/Z: When this is turned on, postings will be displayed at the last trace, line, and vertical slice in the file. When this is turned off, enter Posting End Trace and Z values.
Increment Trace By: Enter a value to determine how often trace values are posted.
Increment Z By: Enter a value to determine how often vertical slice values are posted.
Label: Specify whether to display Shot or CDP information.
Limit Display Extents: Enter a Start and End Trace, and Start and End Z to limit the display extents of the data.
2D Seismic Dataset: Specify the properties for the selected 2D seismic dataset. ![]() See 2D seismic dataset properties...
See 2D seismic dataset properties...
 2D Seismic Dataset Properties
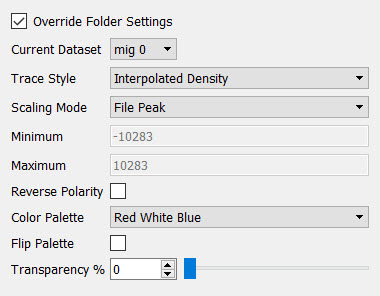
Override Folder Settings: Turn this on to create custom property settings for the current seismic line. When this is turned off the 2D Seismic File Properties are applied to the line.
Current Dataset: Select from the list of available datasets to change the version of the seismic line being displayed.
Trace Style: Specify the display style for the seismic data. If you select Interpolated Density the seismic data will appear smooth. If you select Variable Density the seismic data will appear more blocky.
Scaling Mode: Select a scale mode to determine how the palette will be scaled.
- File Peak: Use the peak value of the data file as the scale reference value.
- File Average: Use the average data value from the data file as the scale reference value.
- File RMS: Use the RMS value from the data file as the scale reference value.
- User Defined: Enter Minimum and Maximum values to use as scale reference values. This is most appropriate when displaying attribute data whose values don't center around zero.
Minimum: The minimum value used to scale against when Range Type is set to Custom. This is most useful when viewing data that is not centered about zero. When another Range Type is selected, this field is informational.
Maximum: The maximum value used to scale against when Range Type is set to Custom. This is most useful when viewing data that is not centered about zero. When another Range Type is selected, this field is informational.
Reverse Polarity: Reverse the polarity of the seismic display.
Color Palette: Select a color palette from the list of available palettes. The palette selection will also be updated in the Palette Toolbar.
Flip Palette: Flip the colors in the palette.
Transparency (%): Adjust the transparency of the item. 0 indicates that the display is fully opaque, and 100 indicates that the display is fully transparent.
Horizon Properties
Horizons: Specify the properties for the horizon. ![]() See horizon properties...
See horizon properties...
 Horizon Properties
Display: Select the attribute to apply as color on the surface of the horizon.
Solid Color: Display the horizon as a solid color. Use the lighting options to accentuate features of the surface.
Z Value: Apply the Color Palette using the Z values associated with the horizon.
Amplitude: Apply the Color Palette using the amplitude values associated with the horizon.
Overlay Amplitude: Apply the Color Palette using the amplitude values associated with the Overlay Horizon selection. Note: The Overlay Horizon option is only available with you select Overlay Amplitude.
Style: Choose a style for the horizon.
Surface: Display the horizon as a solid surface.
Cells: Display the horizon as individual cells at the trace location. Use the Cell Size setting to reduce the size of the cells.
Bin Size: When displaying the horizon as cells, specify the size of the cell as a percent of the original size.
Interpolate: Interpolate the data values to give the object a smooth appearance.
Range Type: When set to Automatic, the minimum and maximum amplitude or Z values are used to apply the color palette to the data. When set to User Defined, enter the Minimum and Maximum values to assign to the color palette. Horizon values that don't fall within this range will be assigned the color associated with the minimum or maximum value.
Color Palette: Select a color palette from the list of available palettes. The palette selection will also be updated in the Palette Toolbar.
Flip Palette: Flip the colors in the palette.
Display Surface: Display the horizon surface. This can be turned off if you only want to display the intersection of the horizon surface with the seismic slices.
Surface Transparency (%): Adjust the transparency of the surface. 0 indicates that the display is fully opaque, and 100 indicates that the display is fully transparent.
Display Slice Intersection: Display the surface only where it intersects the Z-slice.
Intersection Transparency (%): Adjust the transparency of the slice intersection display. 0 indicates that the display is fully opaque, and 100 indicates that the display is fully transparent.
Contours: Specify the properties for the contours associated with the grid. ![]() See horizon contour properties...
See horizon contour properties...
 Contour Properties
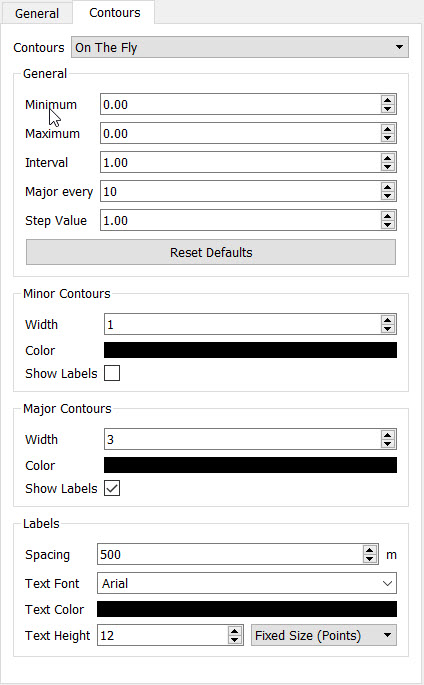
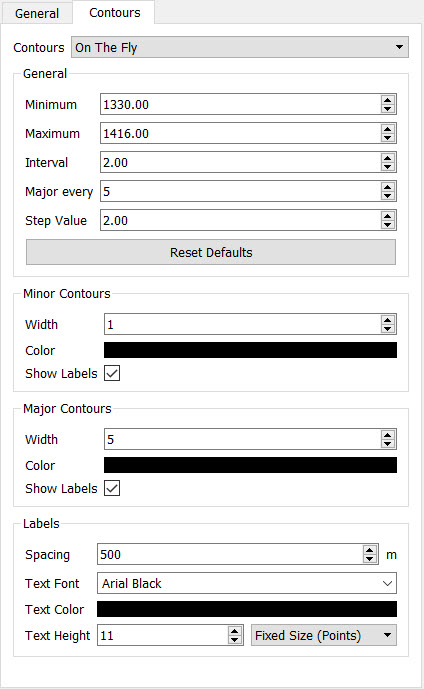
Countours: Select which contours you want displayed on the grid.
None: Do not display any contours. All other options will be grayed out.
On the Fly: Generate contours on the fly. These contours are not saved.
On the GPU: Generate contours on the graphics card. These contours are not saved.
General Options: Enter a Minimum and Maximum contour value, an Interval value, used to determine the spacing of the minor contours, and a Major Every value, used to determine how often a major contour line is placed. For example, with an Interval of "2" and a Major Every value of "5", a major contour line will be placed at intervals of "10".
Minor Contours: Enter a width in pixels, select a color, and turn labels on and off for the minor contour lines.
Major Contours: Enter a width in pixels, select a color, and turn labels on and off for the major contour lines.
Label Spacing: Specify a map distance to determine the distance between contour labels.
Text Font: Specify a font for the contour labels.
Text Color: Click on the color field to open the Select Color dialog box and change the color for the contour labels.
Text Height: Enter a height for the labels in the appropriate units. When Fixed Size (Points) is selected, the labels will retain their size regardless of zoom level. When Variable Size (Meters) is selected, the labels will appear to get bigger as you zoom in, and smaller as you zoom out.
Fault Properties
Faults: Specify the properties for the fault. ![]() See fault properties...
See fault properties...
 Fault Properties
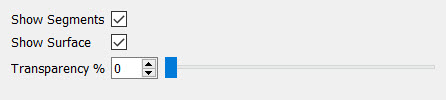
Show Surface: Show the triangulated fault surface. Note: The fault needs to be triangulated in the project to display as a surface.
Show Segments: Show the picked fault segments.
Transparency (%): Adjust the transparency of the item. 0 indicates that the display is fully opaque, and 100 indicates that the display is fully transparent.
Grid Properties
General: Specify the properties for the grid. ![]() See grid properties...
See grid properties...
 Grid Properties
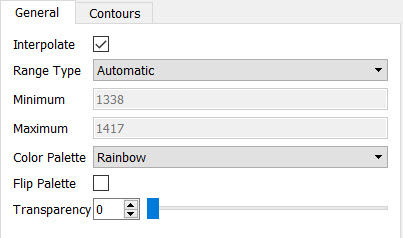
Interpolate: Interpolate the data values to give the object a smooth appearance.
Range Type: When set to Automatic, the minimum and maximum amplitude or Z values are used to apply the color palette to the data. When set to User Defined, enter the Minimum and Maximum values to assign to the color palette. Grid values that don't fall within this range will be assigned the color associated with the minimum or maximum value.
Color Palette: Select a color palette from the list of available palettes. The palette selection will also be updated in the Palette Toolbar.
Flip Palette: Flip the colors in the palette.
Transparency (%): Adjust the transparency of the item. 0 indicates that the display is fully opaque, and 100 indicates that the display is fully transparent.
Contours: Specify the properties for the contours associated with the grid. ![]() See contour properties...
See contour properties...
 Contour Properties
Contours: Select which contours you want displayed on the grid.
None: Do not display any contours. All other options will be grayed out.
On the Fly: Generate contours on the fly. These contours are not saved.
On the GPU: Generate contours on the graphics card. These contours are not saved.
Associated: Use the associated contour from the database. This is the same contour that is displayed on the Basemap. a
General Options: Enter a Minimum and Maximum contour value, an Interval value, used to determine the spacing of the minor contours, and a Major Every value, used to determine how often a major contour line is placed. For example, with an Interval of "2" and a Major Every value of "5", a major contour line will be placed at intervals of "10". Note: The General Options are not available when you select Associated contours.
Minor Contours: Enter a width in pixels, select a color, and turn labels on and off for the minor contour lines.
Major Contours: Enter a width in pixels, select a color, and turn labels on and off for the major contour lines.
Label Spacing: Specify a map distance to determine the distance between contour labels.
Text Font: Specify a font for the contour labels.
Text Color: Click on the color field to open the Select Color dialog box and change the color for the contour labels.
Text Height: Enter a height for the labels in the appropriate units. When Fixed Size (Points) is selected, the labels will retain their size regardless of zoom level. When Variable Size (Meters) is selected, the labels will appear to get bigger as you zoom in, and smaller as you zoom out.
Well Properties
Wells: Specify the properties for the wells. Note: You can't change the properties for individual wells. ![]() See well properties...
See well properties...
 Well Properties
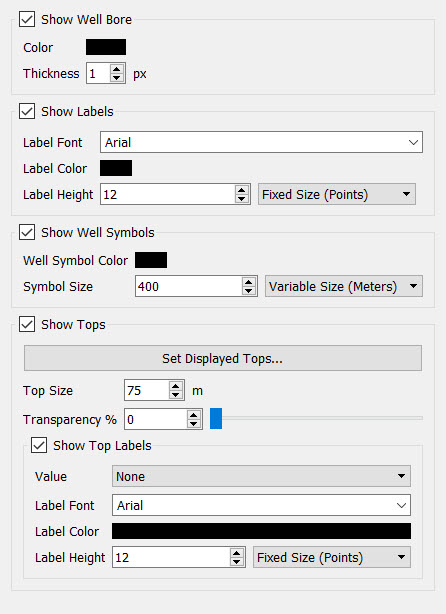
Show Bore: Turn this on to display the well bores.
Well Bore Color: Click on the color field to open the Select Color dialog box and change the color for the well bores.
Thickness: Enter a well bore thickness in pixels.
Show Labels: Turn this on to display labels at the top of the well bore.
Label Font: Specify a font for the well labels.
Label Color: Click on the color field to open the Select Color dialog box and change the color for the well labels.
Label Height: Enter a height for the labels in the appropriate units. When Fixed Size (Points) is selected, the labels will retain their size regardless of zoom level. When Variable Size (Meters) is selected, the labels will appear to get bigger as you zoom in, and smaller as you zoom out.
Show Well Symbols: Turn this on to display well symbols at the top of the well bore.
Well Symbol Color: Click on the color field to open the Select Color dialog box and change the color for the well symbols.
Symbol Height: Enter a height for the symbols in the appropriate units. When Fixed Size (Points) is selected, the symbols will retain their size regardless of zoom level. When Variable Size (Meters) is selected, the symbols will appear to get bigger as you zoom in, and smaller as you zoom out.
Show Tops: Turn this on to display tops as disks along the well bore.
Set Displayed Tops: Open the Display Tops dialog box to select which tops to display. Note: Click  in the Display Tops dialog box to load an existing tops list.
Tops Size: Enter a size for the disk diameter in meters.
Transparency: Adjust the transparency of the tops symbols. 0 indicates that the display is fully opaque, and 100 indicates that the display is fully transparent.
Show Top Labels: Turn this on to label the displayed tops and optionally display depth values.
Value: Select the depth value you want to display. Choose from MD, TVD, Subsea, or None.
Label Font: Specify a font for the tops labels.
Label Color: Click on the color field to open the Select Color dialog box and change the color for the tops labels.
Label Height: Enter a height for the labels in the appropriate units. When Fixed Size (Points) is selected, the labels will retain their size regardless of zoom level. When Variable Size (Meters) is selected, the labels will appear to get bigger as you zoom in, and smaller as you zoom out.
Culture Properties
Culture: Specify the properties for the objects within the selected culture folder. ![]() See culture properties...
See culture properties...
Culture Properties
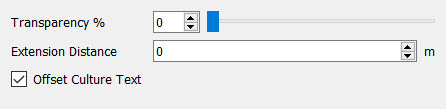
Transparency (%): Adjust the transparency of all of the objects within the culture folder. 0 indicates that the objects are fully opaque, and 100 indicates that the objects are fully transparent.
Extension Distance: Enter the distance in map units that the culture should extend beyond the scene boundaries. Note: The scene boundaries are defined by the largest rectangular extents of the seismic, horizon, grid, fault, or well objects currently being displayed, as well as culture objects with the Include in Scene Extents option turned on.
Offset Culture Text: Offset the text associated with a culture layer from the other objects. Note: When this is turned on you will see a line drawn from the text anchor point to the text.
Culture Object: Specify the properties of a culture object. Note: When you add culture objects to your scene they displayed with their original properties. ![]() See culture object properties...
See culture object properties...
Culture Object Properties
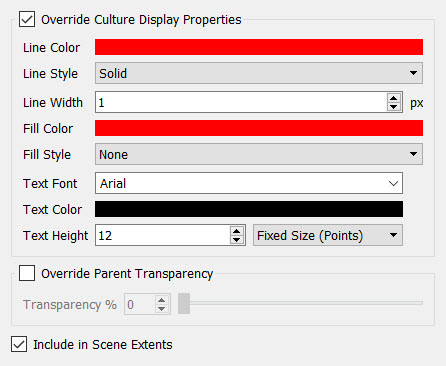
Override Culture Display Properties: Override the original properties of the object. When this is turned on the object properties options become active. When this is turned off the original properties of the object are restored.
Line Color: Click on the color field to open the Select Color dialog box and change the color for the lines of the object.
Line Style: Select a line style. Examples of the line styles are shown below.
Solid |
Dash |
Double Dash |
Arrow Both Ends |
Arrow Head |
Arrow Tail |
Line Width: Specify the line width in pixels.
Fill Color: Click on the color field to open the Select Color dialog box and change the fill color for the object.
Fill
Style: Select a fill style. Examples of the fill styles are shown below.
|
|
|
|
|
|
|
|
|
None |
Text Font: Specify a font for the culture text.
Text Color: Click on the color field to open the Select Color dialog box and change the color for the culture text.
Text Height: Enter a height for the culture text in the appropriate units. When Fixed Size (Points) is selected, the labels will retain their size regardless of zoom level. When Variable Size (Meters) is selected, the labels will appear to get bigger as you zoom in, and smaller as you zoom out.
Override Parent Transparency: Override the transparency set at the culture folder level.
Transparency (%): Adjust the transparency of all of the objects within the culture folder. 0 indicates that the objects are fully opaque, and 100 indicates that the objects are fully transparent.
Include in Scene Extents: Include the culture object when determining the extents of the scene. This should be turned of for large culture layers.
Raster Properties
Raster: Specify the properties for the selected Raster file. ![]() See raster object properties...
See raster object properties...
Raster Properties
Z Value: Set the time or depth value at which the raster image will display.
Transparency: Adjust the transparency of the selected raster. 0 indicates that the objects are fully opaque, and 100 indicates that the objects are fully transparent.
— MORE INFORMATION

|
Copyright © 2020 | SeisWare International Inc. | All rights reserved |