Well Tools: Calculation
The Calculation dialog box is used to apply an algorithm to an existing curve (e.g. smoothing and scaling), and create new log curves from existing log curve data with user-defined equations. Equations can be conditional, giving you a lot of control over the output data. Equations can be applied to all of the wells in a project, a well group, or a cross section, giving you another layer of control.
You can open the Calculation dialog box from the Tools menu in the 3D View, Map View and Cross Section View windows.
Menu
File Menu: Save new operations and load existing operations. ![]() See File menu options...
See File menu options...
Options
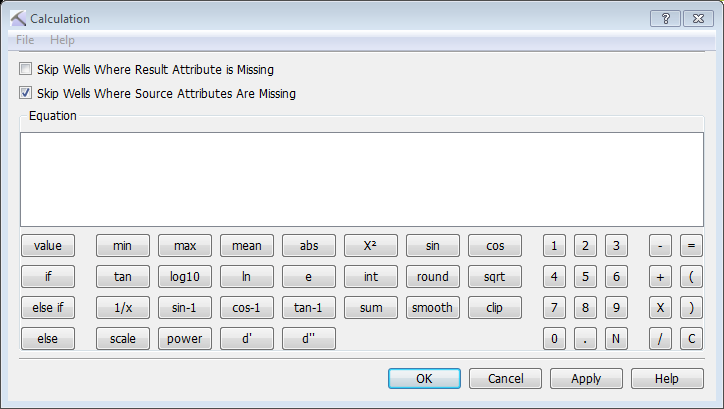
Use the options at the top of the dialog to limit the wells being used in the equation. Note: You will be able to limit the calculation to all of the wells in a well group or cross section after you apply the equation.
Skip Wells Where Result Attribute is Missing: Skip wells that don't contain the result curve. Use this option when you only want to overwrite existing curves.
Skip Wells Where Source Attributes Are Missing: Only apply calculation if all of the curves referenced in the equation are present.
Equation
Use the equation area to build the calculation. You can type directly into the area, but using the buttons will help you create equations with the correct nomenclature. In some cases the button will open an additional dialog box to help you select the input logs and calculation values.
- Enter the name of the output curve. Type the name in the Equation area, or click
 to open the Select or Create Log dialog box to select an existing curve to overwrite, or enter a new curve name.
 - Click
 .
. - Use the operations buttons to create an equation. Some operations require that you select parameters from an additional dialog box, and some require that you enter a value or curve name in brackets after the operation.
Value: Open the Select or Create Log dialog to select from a list of existing curves, or to create a new curve.
 Null: Insert a placeholder representing a NULL value.
 /
/ /
/  If/Else If/Else: Open a Condition dialog box and build complex calculations using Boolean relationships. The condition must be met for the calculation to be performed.
 /
/ /
/ /
/ Min/Max/Mean/Sum: Select up to four log curves and return the minimum, maximum, mean (average) or sum value at each data point to the new curve.
 Absolute Value: Return the absolute value of each data point to the new curve. For example, ABS(-64.5)=64.5.
 Integer: Return the value at each data point with no decimals. For example, INT(64.5)=64. Note that there is no rounding.
 Round: Round the value at each data point to the nearest whole number. For example, ROUND(64.5)=65.
 Smooth: Open the Set Smoothing Parameters dialog box, select a Log to Smooth, and specify a Smoothing Window. The Smoothing Window indicates the number of points above and below the central data point that will be included in the operation.
 Clip: Open the Set Clip Parameters dialog box and select a Log to Clip, and enter Minimum and Maximum clip values. Values lower than the Minimum value are assigned the minimum value, and values higher than the Maximum value are assigned the maximum value. When you use this function you cannot overwrite an existing curve, you must create a new one.
 Scale: Open the Set Scale Parameters dialog box and select a Log to Clip, enter the current Minimum and Maximum values, and then specify the New Minimum and Maximum values. The curve will be linearly rescaled. When you use this function you cannot overwrite an existing curve, you must create a new one.
 /
/ /
/ Sin/Cos/Tan: Return the sine, cosine, or tangent of the input value. Note that the input values cannot be equal to π/2.
 /
/ /
/ Sin-1/Cos-1/Tan-1: Return the secant, cosecant, or cotangent of the input value. Note that the input values must be in the range [-1, 1]
 Log Base 10: Log (base 10) of the input value, where the input value is positive.
 Natural Log: Natural log (base e) of the input value, where the input value is positive.
 E to the Power Of: The number e raised to the power of the input value.
 Reciprocal: Return one divided by the input value.
 Squared: Return the input value raised to the power of two.
 Square Root: Return the square root of the input value, where the input value is positive.
 Raise to a Power: Open the Set Power Parameters dialog box, and select a Basis Log and an Exponent.
 First Derivative: Return a value of zero if the log curve is a local minimum or maximum.
 Second Derivative: If the first derivative is zero, and the second derivative is positive, the log curve value is a local minimum value. If the first derivative is zero, and the second derivative is negative, the log curve value is a local maximum.
Execution Window
Clicking  will open the Execution Window, where you can see the attributes used in the equation, and select the wells whose curves will be used in the included in the operation.
Wells to Operate On: Click to open the Group Selection window, and then select from the list of well groups. This list will include all wells, currently selected wells, wells associated with cross sections, and wells belonging to user-defined well groups.
— MORE INFORMATION

|
Copyright © 2020 | SeisWare International Inc. | All rights reserved |