Seismic Display Properties: Curves
The Curves page allows
you to specify the appearance of
overlay
log and velocity curves within the seismic display.
Curve Appearance
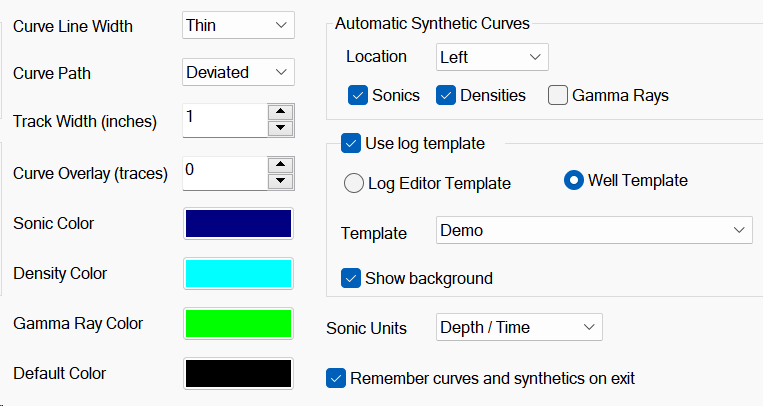
Curve Line Width: Select how curves appear on the seismic.
- Off: Do not display curves. Use this to temporarily remove curves without having to delete them.
- Thin: Display curves using a thin line.
- Medium: Display curves using a medium weight line.
- Thick: Display curves using a thicker line.
Curve Path: Specify how to display curves on deviated wells.
- Straight: Display the curve normally as you would see it for a non-deviated well.
- Deviated: Display curves following the path of the deviated well.
Track Width: The width of the track that a curve is confined to. The size is specified in inches.
Curve Overlay: Specify how many traces to maintain any curve overlays when scrolling through a 3D in the inline or crossline direction. The default value of zero means only display the curves on the current line. When you scroll to the next line the curve will disappear. If you have a value of 5 you can scroll up to five lines away before the curve disappears. When you scroll back the curve will reappear.
Color Properties
Sonic Color: Specify the color for sonic log curves.
Density Color: Specify the color for density log curves.
Gamma Ray Color: Specify the color for gamma ray log curves.
Default Color: Specify the color for all other types of curves (i.e. neither sonic, density or gamma ray).
Automatic Synthetic Curves
You can choose to automatically load log curves into a synthetic
track
when the track is displayed. These parameters determine how
to
display these curves.
Location: Select the location of the curve with respect to the well.
- Left: Display the automatically loaded log curves to the left of the synthetic. The size of the curve will be determined by the Track Width. In addition, a small border will be placed on the left and right side of the curves.
- Center: Display the automatically loaded log curves on top of the synthetic. The Track Width will be ignored when set to center.
- Right: Display the automatically loaded log curves to the right of the synthetic. The size of the curve will be determined by the Track Width. In addition, a small border will be placed on the left and right side of the curves.
- Off: Do not display
any automatically
loaded log curves on the synthetic track.
Sonics: When checked, the viewer will automatically display sonic logs on the synthetic track.
Densities: When checked, the viewer will automatically display density curves on the synthetic track.
Gamma Rays: When checked, the viewer will automatically display gamma ray curves on the synthetic track.
Curve Display Units
Sonic Units: Select the units to display sonic logs in.
- Meters / Second: Display sonic logs in meters per second. This is most useful when displaying generated synthetics so you can properly correlate the curve to the synthetic.
- Original Units: Display sonic logs in
their original units, typically microseconds per meter or microseconds
per feet.
Remember Curves
Remember curves and synthetics on exit: By default the Seismic Viewer will automatically remember any curve overlays or inserted synthetics the next time you display a line. Turn this off and the viewer will no longer save this information.
Use Log Template
This allows you to use a template created in either the Log Editor or the Well Template Designer alongside the well bores in the Seismic Display. If a well doesn't have all the curves associated with the template, only the curves that are present are displayed.
Log Editor Template:Toggle to use a template created and saved in the Log Editor
Well Template: Toggle to use a template created and saved in the Well Template Designer.
Template: Click  to select a saved log template and display the curve information associated with the template next to each well.
Show background: If checked and opaque background will be drawn behind the curves. When off, the curves will be drawn with a transparent background so that the seismic can be seen underneath.
Also See
— MORE INFORMATION

|
Copyright © 2020 | SeisWare International Inc. | All rights reserved |