Cross Section Viewer: Object Properties
The Object Properties dialog box, available in the in the Cross Section Viewer is used to specify the appearance of data objects in the main display and change individual layer properties.
Select an object by doing one of the following:
-
Select an object in the Object Tree dialog box.
-
Click on an object in the scene window. Note: not all objects in the view may be selectable at this time.
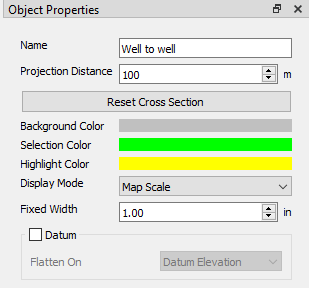
Cross Section Properties
Scene: Specify the general properties for the display window. ![]() See Cross Section properties...
See Cross Section properties...
Well Properties
Well Folder: Specify the properties for all of the wells within the folder. ![]() See well properties...
See well properties...


 Add Label: Add a label to the header. This will add a new entry to the header labels table.
 Duplicate Label: Duplicate the selected label in the header labels table.
 Move Label Up: Move the selected label up a line. Multiple labels can be displayed on the same line. Refer to the Line column in the header labels table to see which line the label is being displayed on.
 Move Label Down: Move the selected label down a line. Multiple labels can be displayed on the same line. Refer to the Line column in the header labels table to see which line the label is being displayed on.
 Open Label Properties: Opens the Well Label Properties dialog for the selected label. Here the label properties can be edited. Use the arrows in the top right corner to view the properties of the previous
  or the next
  well label in the label table. Alternatively, users can click on the label from the table to populate the Well Label Properties.
 Label Properties for GWI Labels

 Delete Label: Delete the selected label.
Logs: For each well, the logs that match the log tracks displayed will be listed. The display properties set in the parent Log Tracks area can be over-ridden here. ![]() See Log properties...
See Log properties...

Tops: Specify the properties for the tops shown in the display. ![]() See well tops properties...
See well tops properties...
Formations Properties
Surfaces are generated on the fly using project formations and a gridding algorithm. The top level properties will allow you to set global defaults for the formation and surface display and gridding parameters for creation. . ![]() See global formations properties...
See global formations properties...
Global Formations Properties
Tops Width: This is the horizontal length of the top markers (ticks) that are drawn on the well bore, specified in points.
Tops Thickness: This is the vertical thickness of the top markers on the well bore, specified in points.
Tops Color: This sets the color of the formation top in the display. Click on the color field to open the Select Color dialog box and change the color for this specific surface.
Display Labels: Toggle this on to show the formation name of the displayed top. You can specify the Font of the label using the dropdown and the Size of the text in points.
Horizontal Position: Specify if you want the labels to be on the Left, Center, or Right of your top marker.
Vertical Position: Specify if you want the labels to be on the Top, Center, or Bottom of your top marker.
Show Background: Toggle on to display a background for the tops labels.
Color: Specify the background color for the tops labels. Click the color field to open the Select Color dialog box and change the color for the tops label background.
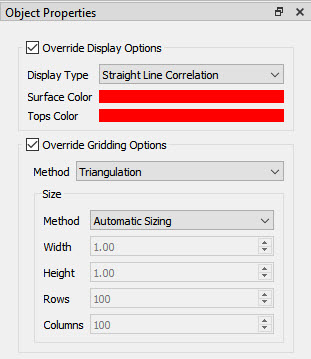
Surface Display Options:These settings control how the surface line is drawing between formations on wells.
Display Type: Specify how the surface between formations on wells should be drawn.
Straight Line Correlation: Use a straight line to connect formations.
Surface grid: Generate a grid using the formations from all wells and display the grid along the cross section page.
None: Do not draw a surface between formations.
Surface Thickness:Specify the vertical thickness of the generated surface line.
Surface Color: Click the color field to open the Select Color dialog box and change the color for the generated surface.
Value to use: When there are multiple formations of the same name, chose which occurence of the formation is used for the display type setting specified above.
Extend to tops outside of viewable range: When the formation exists outside of the viewable area, toggle this on to see correlation lines that may not be continuous across the cross section.
Surface Gridding Options: These are the settings used to generate a surface between tops in the project , and the resulting surface line is used to correlate between the existing tops.
Method: The gridding method being used for creating the surface. Based on the method used, different options will be displayed. Go to the Gridding Methods and Options page to read more about the options.
Size: The final output grid will be based on the extents of the data by default.
Automatic Sizing: Calculates an appropriate bin size to use for creating the final grid.
Manual Width Height: Specify the output Width and Height of the bins that are in the final output grid in map units.
Manual Rows/Colums: Specify the final number of Rows and Columns that should exist in the final output grid.
Formations: Individual formations can have custom settings applied to them. ![]() See individual formation properties...
See individual formation properties...
Log Track Properties
Specify the properties for log tracks. The top level Tracks folder allows you to set global settings for all log tracks.You can then go into each subsequent Tracks folder to set global settings for that track. ![]() See global log track properties...
See global log track properties...
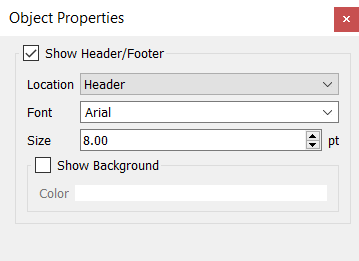 Location: Specify where to display log track labels.
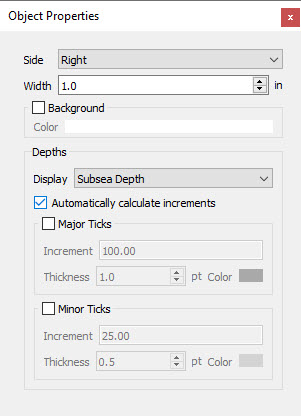
Log Tracks: Customize the display for each log track type. Note: You can alter individual well log tracks by going to the logs for the well in the Wells folder. See ![]() log track properties...
log track properties...

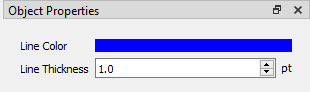
Grid Properties
Specify the properties for the grids that are chosen for display. Grids are drawn simply as lines in the display and can also be used for Datuming. ![]() See grid properties...
See grid properties...
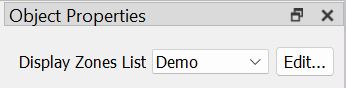
Zone Properties
Specify the properties for the zones that are chosen for display. Zones are drawn as semi-transparent blocks of color in the display. ![]() See zone properties...
See zone properties...
 to launch
 Seismic Properties
Specify the properties for the seismic volume that is chosen for display.
Seismic is drawn as an underlay beneath the wells in the cross section.
![]() See seismic properties...
See seismic properties...

— MORE INFORMATION

|
Copyright © 2020 | SeisWare International Inc. | All rights reserved |