Geoscience > Main Launcher > Seismic Menu > Data Loader > 3D Data Loading > Keywords > Sample Keyword Graphs
Sample Graphs for Keywords in the SEG-Y Viewer
When you're defining keywords it's often helpful to graph the word
values to make sure you're defining the right keyword, and that the
keyword remains consistent throughout the file.
2D Keyword Graphs
3D Keyword Graphs
Sample Graph for CDP
The CDP number normally increases by 1 as the trace number increases by 1. As a result, the graph of this number increases with a constant slope.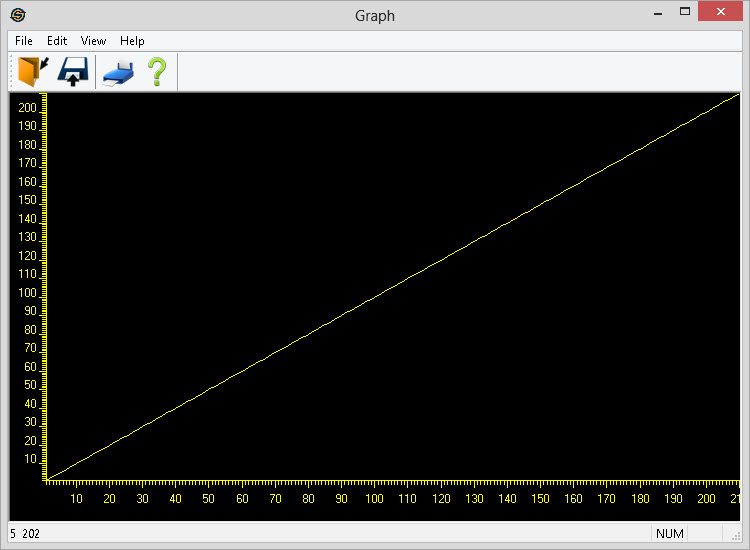
Sample Graph for Shot Sequence Number
The Shot Sequence Number often increments by 0.5. Because some formats do not have decimals, the shot sequence might increase by an integer value, for example, 50 or 500. The number should increment consistently through the entire file, and the graph should have a constant slope.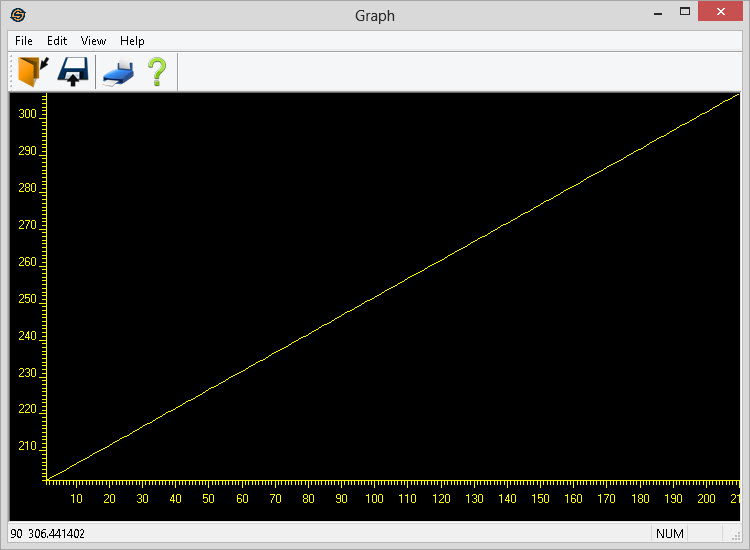
Sample Graph for Coordinate X and Coordinate Y
The graphs for these are usually fairly linear and may be increasing or decreasing. Because these represent geographical X and Y values, they may have kinks or bends. 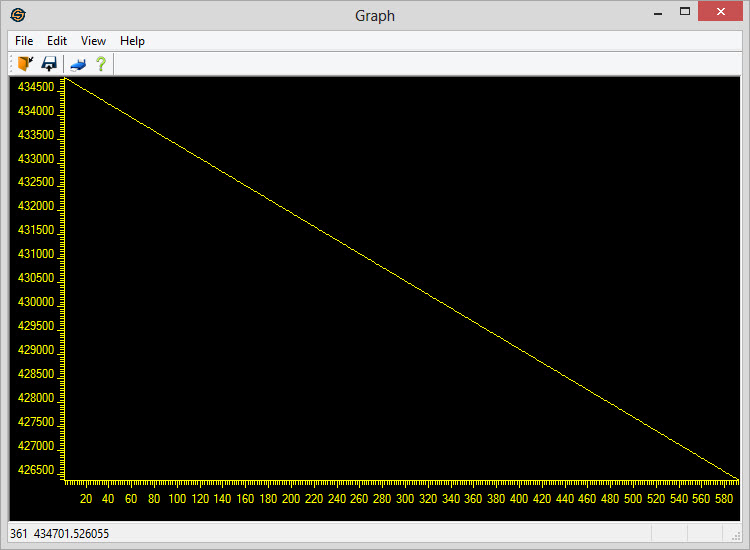
Coordinate
X Graph, 2D Survey
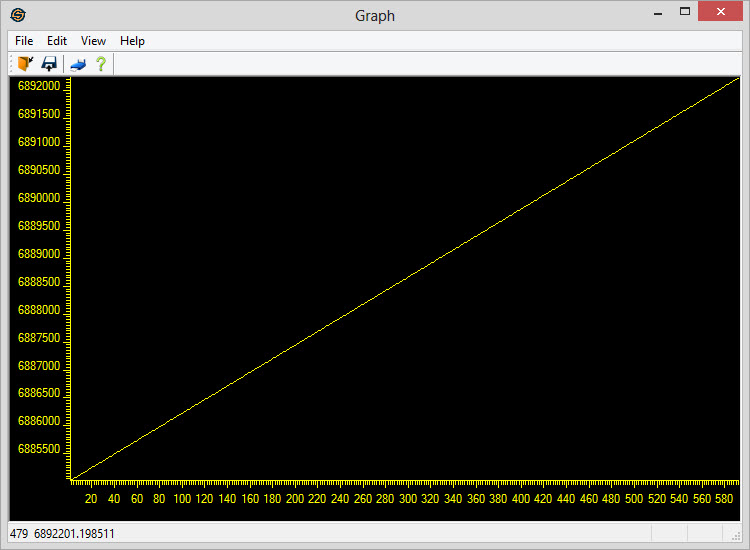
Coordinate
Y Graph, 2D Survey
Sample Graph for Line Sequence Number
The Line Sequence Number increments at the end of every line. As a result, the graph resembles a staircase. The width of the "stairs" depends on how many traces there are in each line. You may need to change the number of traces that you graph to get an accurate picture for this keyword.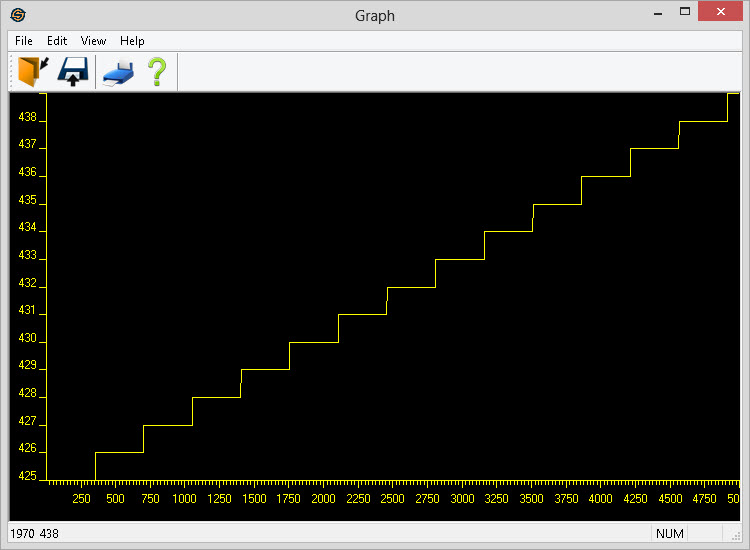
Sample Graph for Trace Sequence Number
The Trace Sequence Number increases by 1 until the Line Sequence Number increments, at which point the Trace Sequence Number drops to its starting point and begins increasing again. As a result the graph resembles a "sawtooth". The width of the "teeth" depends on how many traces there are in each line. You may need to change the number of traces that you graph to get an accurate picture for this keyword.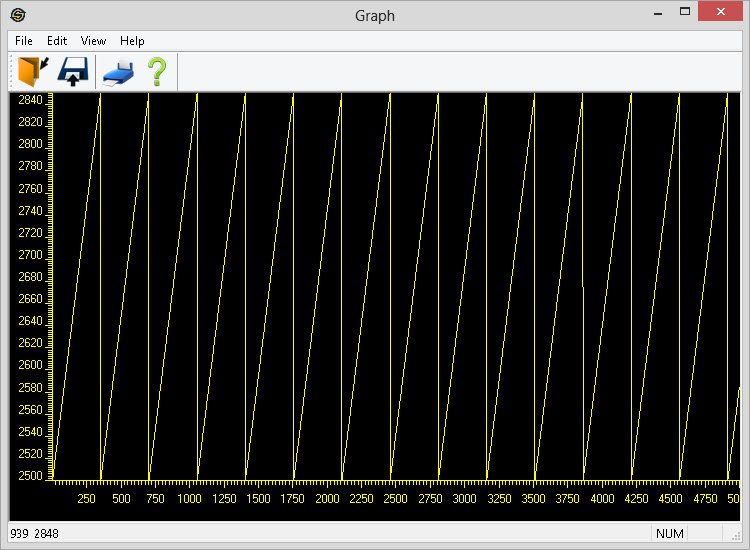
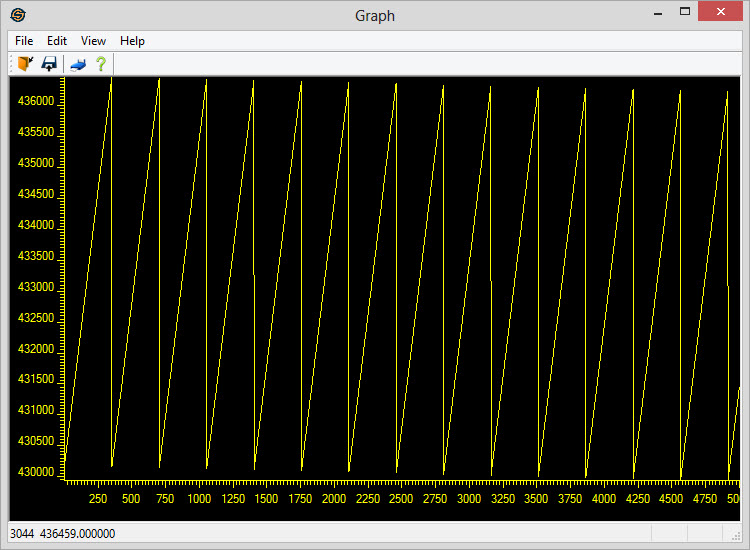
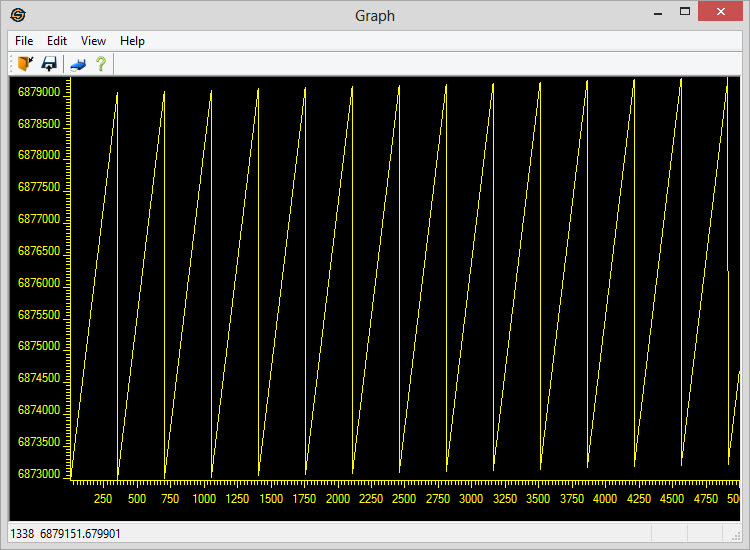
Sample Graphs for Coordinate X and Coordinate Y (3D)
The graphs for Coordinate X and Coordinate Y may be increasing or decreasing, depending on how the survey was shot, and may resemble a "staircase", a "sawtooth" or a combination of both. The width of the "stairs" or the "teeth" depends on how many traces there are in each line. You may need to change the number of traces that you graph to get an accurate picture for this keyword.Coordinate X Graph, 3D Survey
Coordinate Y Graph,
3D Survey
— MORE INFORMATION

|
Copyright © 2020 | SeisWare International Inc. | All rights reserved |