Cross Plot: Trend Dialog Box
 The Trend dialog box allows you to create a trend line to overlay on your data. To create a new trend line, on the Secondary Toolbar click the Add New Trend Line icon
 ![]() .
.
When you add a new trend line to your display, a new tab is added at the bottom of the dialog box. Click on a tab to access its properties. To remove a trend line, select it in the Legend dialog box and click the delete icon.
Name: Enter a name for the trend line. This will appear in the Legend dialog box.
Axis: Select a plot to determine the data to use when calculating the trend.
Equation: When you choose to display an Arbitrary trend line, enter an equation.
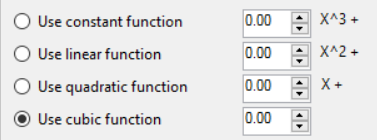
 Set Coefficients from Axis: Use the trend line data from the associated plot to populate the equation fields.
Trend Fitting: Determines the data to use when generating the trend line. Use all of the data from the selected plot or the data with the selected Polygon. When using data within a polygon, a selection polygon must have already been added to the cross plot.
Polygon: Select a polygon to use when generating the trend line using data within a polygon.
Color: Select the color of the trend line.
Width: Select the width of the trend line.
Line Style: Select the style of the trend line.
Limits: Specify how the limits of the data will be determined.
Data Extents: All of the data on the Axis, or within the Polygon when selected, will be used.
View: Only data within the current view, and within the Polygon wen selected, will be used.
— MORE INFORMATION

|
Copyright © 2020 | SeisWare International Inc. | All rights reserved |