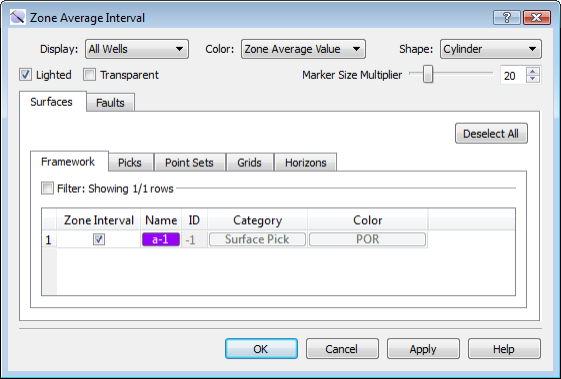
3D View Tools: Zone Average Interval
The Zone Average Interval dialog box is used to determine which zone average intervals are display in the 3D View window, and how they appear. Zone average values are calculated by taking the average of multiple log curve values over a specific zone. This dialog box displays all zone averages that are currently defined as overlays in the Surface Display and Data dialog box. The values can be displayed as cylinders or spheres on the wells in the display.
To open the Zone Average Interval dialog box, from the View menu, select Zone Average Interval. Surface Display and Data dialog box, click in the Extrapolation Method, Extrapolation Buffer, or Hull Connectivity cells.
Display Options:
Display: Select for which wells you want the zone average intervals to display. Choose from Off, Selected Wells, and All Wells.
Color: Choose a color for the zone average interval markers.
Zone Average Value: The makers are displayed using the Color Spectrum associated with the zone average.
Solid Grid Color: The markers are displayed using the defined color of the upper surface of the zone.
Shape: Choose a shape for the interval markers. Note that when you are using a lateral interval to define multiple zones along your well bore, each average value is represented by a separate marker, and results are best viewed as Cylinder.
Cylinder: Draw the marker as a cylinder along the well bore from the top of the zone to the bottom of the zone.
Sphere: Draw the marker as a sphere at the mid-point between the entry point of the well into the zone and the exit point of the well from the zone. This will show you the exact spatial location of the calculated zone average value.
Vertical Cylinder: Draw the marker as a vertical cylinder centered at the mid-point between the entry point of the well into the zone, extending from the top of the zone to the bottom of the zone. This will show you the spatial location of the calculated zone average value in relation to the thickness of the zone.
Lighted: Turn lighting on to give intervals a matte appearance.
Transparent: Turn this on to prevent the interval marker from obscuring other objects on the display, specifically log curve data.
Size: Use the slider or enter a value to adjust the diameter of the interval markers.
Surfaces and Faults Tabs
Use the Surfaces and Faults tabs to select zone average interval you want to display. This section displays all zone averages that are currently defined as overlays in the Surface Display and Data dialog box.
Column Definitions
Zone Interval: Place a check mark next to each zone interval you want to display.
Name: The name of the surface associated with the zone average defined in the Color Overlay column in the Surface Display and Data dialog box. This represents the color that will be used when Solid Grid Color is selected from the Color options.
ID: Any value other than “-1” indicates that the data was loaded from OpenWorks. This column is for information only.
Category: The surface type. This informational column is useful on the Framework tab where multiple data types can be present.
Color: The name of the curve being used to calculate the zone average value.
— MORE INFORMATION

|
Copyright © 2020 | SeisWare International Inc. | All rights reserved |