Geoscience > Main Launcher > Seismic Menu > Seismic Viewer > Additional Resources > Print Properties
Seismic Viewer: Print Properties
The Print Properties dialog box allows you to configure various
parameters for hard copy plotting.
Print Properties Tabs
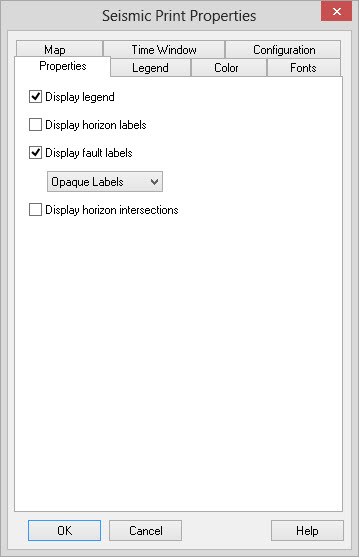
Properties
|
Specify the annotation that
appears around the seismic - the legend, horizon/fault names and
the horizon intersections. Display
legend: Turn this off this
item to quickly turn off the entire legend on seismic
plots. Display horizon labels: Outputs horizon labels next to the horizon itself. Labels are output at the left-most trace that the horizon exists. Display fault labels: Outputs fault labels next to the fault. Transparent Labels vs Opaque Labels: Allows you to set the background of horizon and fault labels. When transparent you will be able to see the seismic behind the label. When opaque a white area will cover part of the seismic, but makes the label more readable. Display horizon intersections: Outputs the horizon intersection "X" marks on the plot. |
Legend

|
Specify which items should be
displayed with the sidebar legend. Display legend:When Display Legend is turned on all of the selected items will plot on the sidebar legend. Display
seismic parameters: Puts a description of the seismic
parameters such as traces per inch on
the side bar label. Display scale bar: Adds a scale bar to the side bar label. Note: you will not see the scale bar when the "Use traces per inch" scaling option is used. Display colorbar: Outputs the colorbar with annotation on the left side of the plot. Set the Height parameter to specify the total height of the colorbar. Display horizon legend: Outputs a legend showing the horizons names and colors on the left side of the plot. Display project information: Prints information such as the project name on the side label. Include user and machine names: Prints the name of you and source machine on the side label. Often used in large companies to identify plots. Display EBCDIC header: Plots out the EBCDIC header on the side label. The EBCDIC header is only plotted when a single dataset is displayed. The EBCDIC versus ASCII label allows you to specify how the data appears. Occasionally EBCDIC headers will contain ASCII format characters. Display title: Allows you to quickly turn the Plot Title and Plot Description on and off. Plot Title: Specify a multiple line title that appears at the top of the plot. Plot Description: Specify a multiple line description of the plot properties. |
Color
|
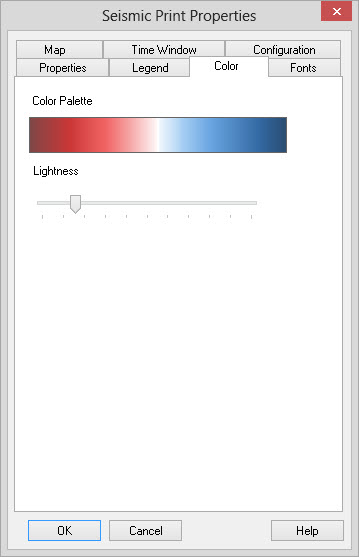
Allows you to adjust the
brightness of the color in the resulting plot. Often hard copy plots
come out too saturated, or with so much ink that they do not dry
properly. This allows you to tone down the resultant plot without
having to select a new color palette. Color Palette:
The current color
palette that will be used for printing. Lightness: Specifies how light or dark to print the color palette. Move the slider to see how it interactively upsets the color palette. |
Fonts
|
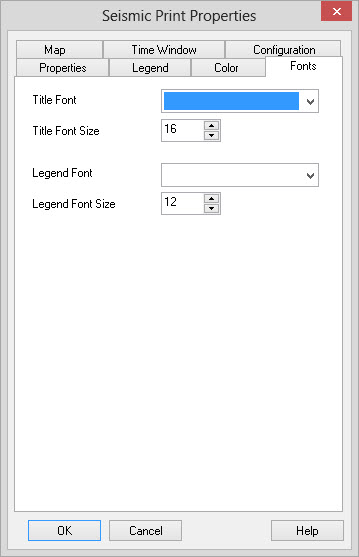
Specify the fonts that should be
used in the plot. Note: all font sizes are
specified in points. Title Font: Specify
the font type and
size for the title of the plot. Legend Font: Specify the font type and size for all other text appearing in the side bar legend. fonts to use for side bar annotation. |
Map
|
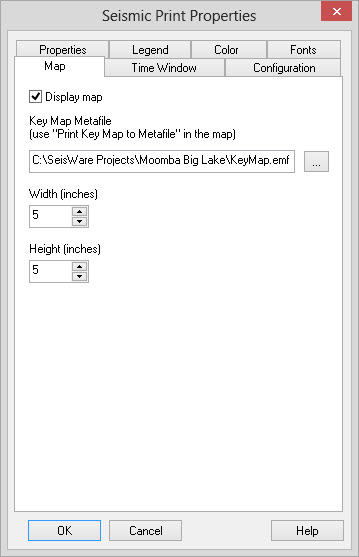
Specify parameters for a key map
that appears in the side bar legend. This is necessary because it
is not always possible to determine which map view is most desirable,
especially when multiple maps are being displayed. Display map: When
turned on a keymap
will print next to the seismic plot. Key Map Metafile: Specify the full path of the key map windows enhanced metafile. This may be the location specified in General Basemap Properties when automatically generating a keymap. Width: Specify the width of the key map on the resulting plot. Height: Specify the height of the key map on the resulting plot. |
Time Window
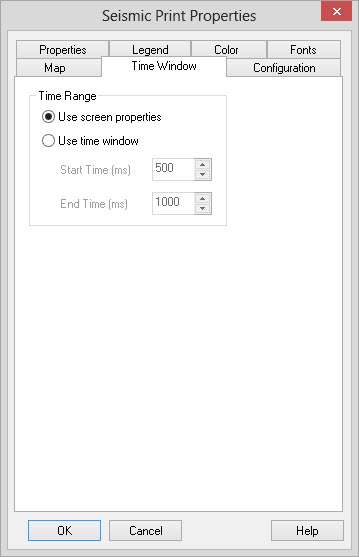
|
Specify an optional time window
for plots. This item is useful when trying to improve the appearance of
flattened sections where there is a lot of null seismic values at the
top or bottom of the plot. Use screen
properties: Select this
item to plot the full time window of the screen when
printing. Use time window: Select this item to limit the time range of the seismic plot to something other the range of data in the seismic display. Note: this item is useful when trying to improve the appearance of flattened sections where there is a lot of null seismic values at the top or bottom of the plot. Start Time:
Specify the start time of the data window in milliseconds. Only
meaningful when Use time window has been selected. End Time:
Specify the end time of the data window in milliseconds. Only
meaningful when Use time window has been selected. |
Configuration
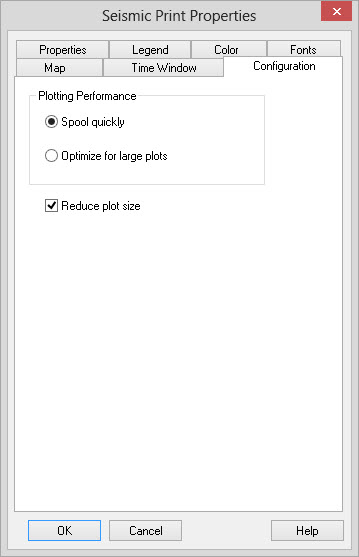
|
Specify plotting configuration
parameters. These are common to all projects. Plotting
Performance: Select
properties that can affect plotting performance. Spool quickly:
This is the fastest way to produce a plot. The Seismic Viewer will be finished processing
the plot more quickly, allowing you to continue working. This option is most useful when printing relatively small
plots, and when making a large amount of plots. Optimize for large plots: Choose this option when trying to output large plots. The viewer will be busy processing the plot for a longer period of time. This means it will take longer for control of the viewer to be returned to you. Large plots often fail with the Spool Quickly option, so it may be necessary to use this option in order to produce output. Reduce plot size: Check
this item to reduce the size of the resulting plot file.
Typically you will leave this item on. Selecting this option will
generally improve the speed of plotting. If your plotter or computer
has a small amount of memory and plots are failing turn this item off
to see if it corrects the problem. |
— MORE INFORMATION

|
Copyright © 2020 | SeisWare International Inc. | All rights reserved |