Data Statistics
Use this dialog to examine the amplitude distribution of the
data
in the original source files. It will generate a data histogram for
each file, as well as an optional peak
profile graph for each file.
This will help you set a reasonable statistics window, as well as
reveal possible difficulties such as an incorrectly set data
format.
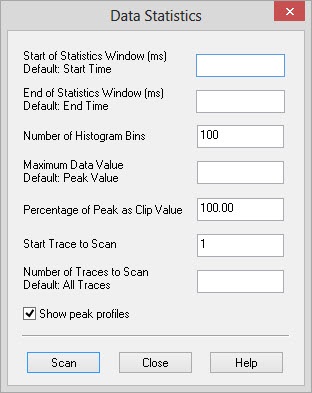
End of Statistics Window: Specify the end time or depth used to calculate the peak average and RMS data statistics. The default value is the end of the data. You may want to specify this value to restrict statistics calculations to your zone of interest, or to clip out spikes in the data for statistics purposes.
Number of Histogram Bins: Calculating the statistics generates a data histogram. This value specifies the number of bars to divide the histogram into. The default value of 100 is normally sufficient, although you may want to increase this number to isolate spikes in the data.
Maximum Data Value: Use this to specify the maximum data value for the histogram. If you do not specify a value the data will be scanned to determine the peak value of all the data files for use as the peak value in the histogram. You will want to specify this value if you have spikes in your data that will tend to skew the histogram. When loading from tape the scan for the peak data value can take a long time, so specifying this value will speed up the statistics calculation.
Percentage of Peak as Clip Value: Use this value to automatically clip out spikes from your data. It can also be useful to specify this value when converting your data to 16 bit integer. Clipping out some of the data can help preserve the dynamic range of your data when scaling to 16 bit data.
The default value of 100 means do not clip the data. As an example if your peak value is 10,000 and your clip value is 90, then any samples with a value greater than 9,000 will be clipped and given the value 9000 rather than their actual value.
Number of Traces to Scan: Specify the number of traces to scan for each file. If you do not specify this value all traces are scanned. You can set this value to clip out garbage contained at the end of a file. Setting a value is also very useful when loading from tape where it can speed up the entire operation, especially when loading a single 3D line.
Show peak profiles: Check this item to generate the optional peak profile graph. This is a graph of the maximum absolute sample value for all the traces scanned at each point in time. This graph can help identify spikes in your data, or reveal your zone of interest.
 Scan the
data and generate the histograms and optional peak
profile graphs. A status dialog will pop up when scanning the data. You
can hit the Stop button at any time which will cancel the current
operation and display histograms and peak profiles for the files that
have already been scanned.
Scan the
data and generate the histograms and optional peak
profile graphs. A status dialog will pop up when scanning the data. You
can hit the Stop button at any time which will cancel the current
operation and display histograms and peak profiles for the files that
have already been scanned.Peak Profiles
This displays the maximum absolute amplitude at each sample for the entire file. Large spikes at the surface or at depth may indicate that a statistics window needs to be set.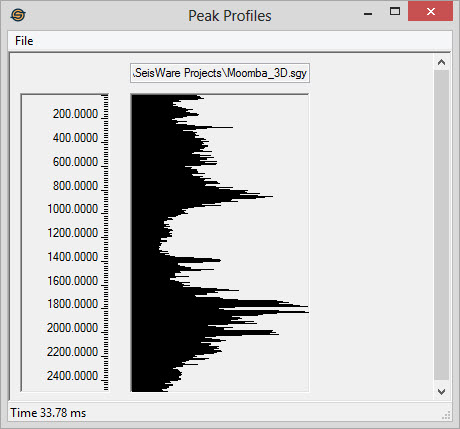
Data Histogram
This display represents a histogram of the data in each file you have scanned. The Y axis represents amplitude and the X axis represents the number of samples of data at that amplitude. The data will typically be a half bell-shaped curve. If it is not it may indicate a problem with the data format.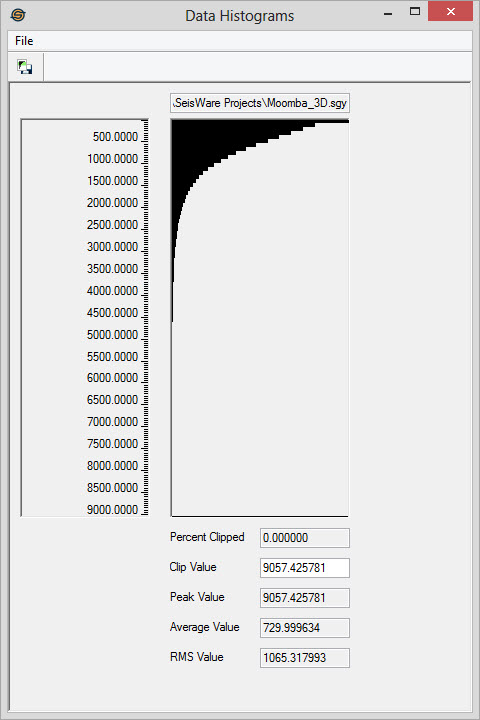
Peak Value: The peak value of all samples scanned.
Average Value: The average value of all samples scanned.
RMS Value: The RMS value of all samples scanned.
— MORE INFORMATION

|
Copyright © 2020 | SeisWare International Inc. | All rights reserved |